


Item 5
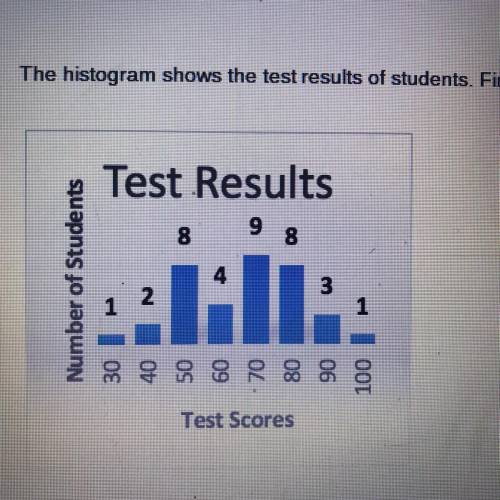
The histogram shows the test results of students. Find the mean and the standard deviat...

Mathematics, 05.05.2020 17:21, maddie6610
Item 5
The histogram shows the test results of students. Find the mean and the standard deviation.
a. What is the mean and the standard deviation? Round to the nearest hundredth.
Mean =
standard deviation =
b. What percent of the students tests scores fall within 1 standard deviation of the mean? Round to the nearest hundredth.
Percent of students who fall within 1 standard deviation of the mean = %
c. What percent of the students tests scores are more than one standard deviation above the mean? Round to the nearest hundredth.
Percent of students whose tests scores are more than one standard deviation above the mean = %
d. What percent of the students tests scores are more than one standard deviation below the mean? Round to the nearest hundredth.
Percent of students whose tests scores are more than one standard deviation below the mean = %

Answers: 3
Other questions on the subject: Mathematics
Mathematics, 22.06.2019 01:10, aidanfbussiness
I'm marking the brainliest and it's 15 points
Answers: 1
Do you know the correct answer?
Questions in other subjects:


Chemistry, 14.07.2019 14:00

Mathematics, 14.07.2019 14:00

Spanish, 14.07.2019 14:00


