

Mathematics, 05.05.2020 17:03, happy121906
The heights of a group of boys and girls at a local middle school are shown on the dot plots below. 2 dot plots with number lines going from 40 to 60. A plot is titled Boy's Heights. There are 0 dots above 40, 1 above 41, 3 above 44, 3 above 46, 2 above 48, 3 above 50, 4 above 52, 4 above 54, and 0 above 56, 58, and 60. A plot is titled Girl's Heights. There are 0 dots above 40 and 41, 2 dots above 44, 3 above 46, 1 above 48, 3 above 50, 4 above 52, 3 above 54, 4 above 56, and 0 above 58 and 60. When comparing the shapes of the two sets of data, what conclusion can someone draw? The shortest boy is taller than the shortest girl. The range for the girls is greater than the range for the boys. There is an outlier in the data for the boys, but not for the girls. The girls are generally taller than the boys. PLEASE HELP ME I ONLY HAVE 1 HOUR

Answers: 2


Other questions on the subject: Mathematics
Mathematics, 21.06.2019 13:40, httpcindy14
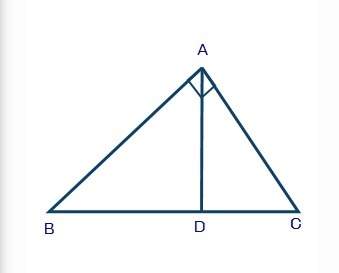
Classify the following triangle check all that apply
Answers: 1
Mathematics, 21.06.2019 22:30, mackenziepaige6525
The median for the given set of six ordered data values is 29.5 9 12 25 __ 41 48 what is the missing value?
Answers: 1
Do you know the correct answer?
The heights of a group of boys and girls at a local middle school are shown on the dot plots below....
Questions in other subjects:

Mathematics, 27.05.2021 01:00


History, 27.05.2021 01:00
Mathematics, 27.05.2021 01:00

Chemistry, 27.05.2021 01:00


