


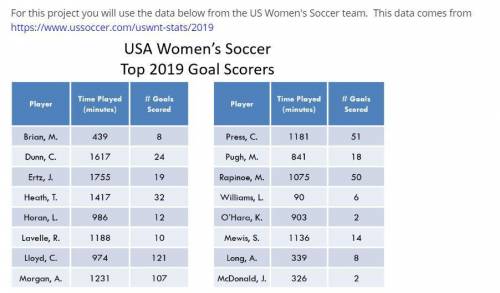
1 fill in the frequency table for time played in minutes.
2 Use desmos to make a histogram for...

Mathematics, 06.05.2020 06:08, lindseycagle00
1 fill in the frequency table for time played in minutes.
2 Use desmos to make a histogram for the frequency table in #2. Take a screenshot of your histogram and save it on your computer. and put it on here
3 Describe your histogram in #3 in 1-2 sentences. What type of data distribution is this (bell, uniform, skewed right, or skewed left)? How do you know what type of distribution your graph shows?
4 fill in the frequency table for # of goals scored.
5 make a histogram for the frequency table in #5. Take a screenshot of your histogram and save it on your computer. and share it here please
Describe your histogram in #6 in 1-2 sentences. What type of data distribution is this (bell, uniform, skewed right, or skewed left)? How do you know what type of distribution your graph shows?
thank you :)

Answers: 1
Other questions on the subject: Mathematics
Mathematics, 21.06.2019 19:00, sammizwang
Marina baked cookies. she gave 3/4 of the cookies to the scout bake sale. she shared the remaining 6 cookies with her friends. how many cookies did marina bake?
Answers: 3
Mathematics, 21.06.2019 23:30, marianaescamilla404
Scenario: susan wants to make 2 square flags to sell at a crafts fair. the fabric she wants to buy is 3 meters wide. she doesn't want any fabric left over. what's the least amount of fabric she should buy? question: which equation will susan solve her problem? note: let x represent the length of 1 side of the flag. options: 1) 2x^2 = 4x 2) 8 +2x = 2(4x) 3) 2 * 2 = 4 * 2 4) 4x^2 -2x = 0
Answers: 2
Do you know the correct answer?
Questions in other subjects:
Mathematics, 18.10.2020 23:01


Mathematics, 18.10.2020 23:01

English, 18.10.2020 23:01


