


The graph below shows a scatter plot of the growth rate of a beagle puppy,
relating the puppy'...

Mathematics, 06.05.2020 07:40, Frenchfries13
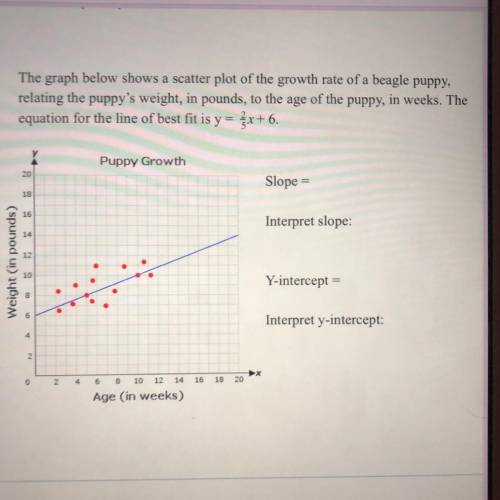
The graph below shows a scatter plot of the growth rate of a beagle puppy,
relating the puppy's weight, in pounds, to the age of the puppy, in weeks. The
equation for the line of best fit is y= x+6.
Slope =
Interpret slope:
Y-intercept =
Interpret y-intercept:

Answers: 1
Other questions on the subject: Mathematics
Do you know the correct answer?
Questions in other subjects:

Social Studies, 08.04.2020 18:41


Physics, 08.04.2020 18:41
Mathematics, 08.04.2020 18:41


Mathematics, 08.04.2020 18:41


