Mathematics, 27.04.2020 03:16, sickboi
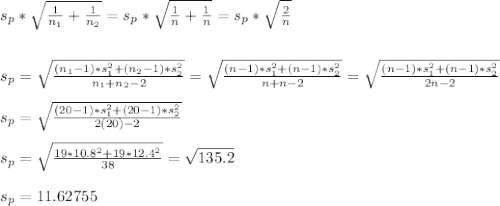
The principal at Crest Middle School, which enrolls only sixth-grade students and seventh-grade students, is interested in determining how much time students at that school spend on homework each night. The table below shows the mean and standard deviation of the amount of time spent on homework each night (in minutes) for a random sample of 20 sixth-grade students and a separate random sample of 20 seventh-grade students at this school. Based on dotplots of these data, it is not unreasonable to assume that the distribution of times for each grade were approximately normally distributed.
Estimate the difference in mean times spent on homework for all sixth- and seventh-grade students in this school using an interval. Be sure to interpret your interval.
An assistant principal reasoned that a much narrower confidence interval could be obtained if the students were paired based on their responses; for example, pairing the sixth-grade student and the seventh-grade student with the highest number of minutes spent on homework, the sixth-grade student and seventh-grade student with the next highest number of minutes spent on homework, and so on. Is the assistant principal correct in thinking that matching students in this way and then computing a matched-pairs confidence interval for the mean difference in time spent on homework is a better procedure than the one used in part (a) ? Explain why or why not.

Answers: 3
Other questions on the subject: Mathematics

Mathematics, 21.06.2019 12:50, 1963038660
The perimeter of a rhombus with a side of 6 is 24
Answers: 1

Mathematics, 22.06.2019 01:30, joytheqt305
Arecent study focused on the number of times men and women who live alone buy take-out dinner in a month. assume that the distributions follow the normal probability distribution and the population standard deviations are equal. the information is summarized below. statistic men women sample mean 24.85 21.33 sample standard deviation 5.54 4.93 sample size 34 36 at the 0.01 significance level, is there a difference in the mean number of times men and women order take-out dinners in a month? state the decision rule for 0.01 significance level: h0: μmen= μwomen h1: μmen ≠ μwomen. (negative amounts should be indicated by a minus sign. round your answers to 3 decimal places.) compute the value of the test statistic. (round your answer to 3 decimal places.) what is your decision regarding the null hypothesis? what is the p-value? (round your answer to 3 decimal places.)
Answers: 1

Mathematics, 22.06.2019 01:30, maymuu4life
As a self-employed seamstress, you know that it takes 7 yards of material to make 3 jackets. you bought 15 yards of material to make 7 jackets. did you buy enough material? if not, how much were you over or under?
Answers: 1

Mathematics, 22.06.2019 03:30, 2337911726
*15 pts* the graph of an exponential function of the form y = f(x) = ax passes through the points and the graph lies the x-axis. first line choices: (0, a) (0, 1) (0, 2) (0, -1) second line choices: (1, 0) (1, a) (1, 1) (1, -2) third line choices: above below on the
Answers: 1
Do you know the correct answer?
The principal at Crest Middle School, which enrolls only sixth-grade students and seventh-grade stud...
Questions in other subjects:


Mathematics, 12.09.2019 22:10


Mathematics, 12.09.2019 22:10

Mathematics, 12.09.2019 22:10


