


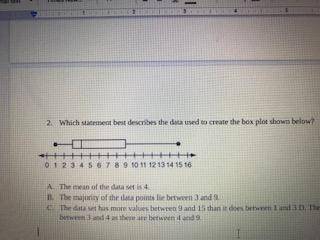
Which statement best describes the data used to create the box plot shown below?
The me...

Mathematics, 26.04.2020 07:45, davia97
Which statement best describes the data used to create the box plot shown below?
The mean of the data set is 4.
The majority of the data points lie between 3 and 9.
The data set has more values between 9 and 15 than it does between 1 and 3 D. There are as many data points between 3 and 4 as there are between 4 and 9.

Answers: 2
Other questions on the subject: Mathematics
Mathematics, 21.06.2019 18:30, Binger4115
If you have the following equation, 2/3x+5/6-x=2-3/4x what would you multiply each term by to get rid of all the fractions
Answers: 3
Mathematics, 21.06.2019 19:00, mylittleponeyfbrarit
When keisha installed a fence along the 200 foot perimeter of her rectangular back yard, she left an opening for a gate. in the diagram below, she used x to represent the length in feet of the gate? what is the value? a. 10 b. 20 c. 25 d. 30
Answers: 1
Do you know the correct answer?
Questions in other subjects:


English, 24.08.2019 08:30


Spanish, 24.08.2019 08:30
Mathematics, 24.08.2019 08:30


