

Mathematics, 24.04.2020 23:26, diegop07
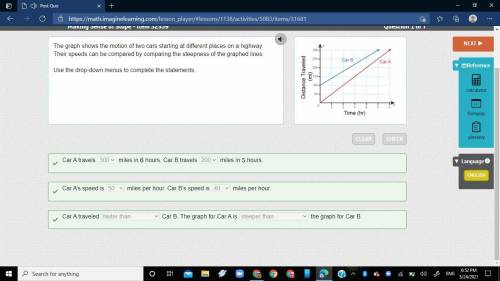
The graph shows the motion of two cars starting at different places on a highway. Their speeds can be compared by comparing the steepness of the graphed lines.
Use the drop-down menus to complete the statements.
Car a travels (50,100,200,300) miles in 6 hours Car B travels (50,100,200,300) miles in 5 hours
Car A speed is (40,50,60,125,) miles per hour Car B speed is(40,50,60,125) miles per hour.
Car A traveled (faster than, slower than, the same speed) as Car B.
The graph for Car A is(steeper than, less steeperhan, or same steepness) as the graph for Car B


Answers: 1


Other questions on the subject: Mathematics
Mathematics, 21.06.2019 17:00, SoccerHalo
16. you're planning to buy a boat, a motor, and some miscellaneous boating equipment. the boat costs $325, the motor costs $225, and the equipment costs $79. if you've saved $438 toward these purchases, how much more do you need to save? a. $181 b. $281 c. $291 d. $191
Answers: 3
Do you know the correct answer?
The graph shows the motion of two cars starting at different places on a highway. Their speeds can b...
Questions in other subjects:


History, 13.01.2021 18:40

Mathematics, 13.01.2021 18:40


