


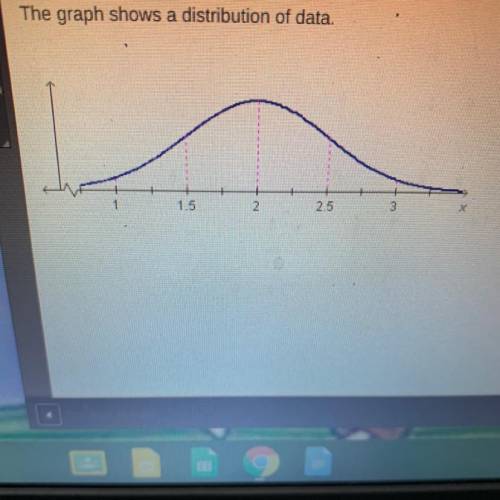
The graph shows a distribution of data.
What is the standard deviation of the data?
0.5<...

Mathematics, 24.04.2020 22:58, areeves39276
The graph shows a distribution of data.
What is the standard deviation of the data?
0.5
1.5
2.0
2.5

Answers: 1
Other questions on the subject: Mathematics
Mathematics, 20.06.2019 18:04, putaprincess16
The diagonals of a rhombus are 12 inch and 16 inch long, the length of a side of a rhombus is 10 inch, what is the height of the rhombus
Answers: 1
Mathematics, 21.06.2019 17:40, jackieespi1461
Multiply. write your answer in simplest form. 3/8 x 5/7
Answers: 1
Mathematics, 21.06.2019 20:00, soniah
Pepe and leo deposits money into their savings account at the end of the month the table shows the account balances. if there pattern of savings continue and neither earns interest nor withdraw any of the money , how will the balance compare after a very long time ?
Answers: 1
Do you know the correct answer?
Questions in other subjects:


History, 06.05.2020 18:58

Biology, 06.05.2020 18:58


