


Price
200
Month
Which graph appears to show the best performance? Which scale make...

Mathematics, 24.04.2020 08:00, alexandrecarmene
Price
200
Month
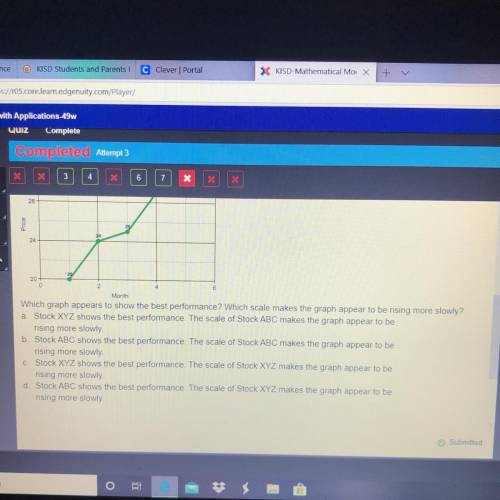
Which graph appears to show the best performance? Which scale makes the graph appear to be rising more slowly?
a. Stock XYZ shows the best performance. The scale of Stock ABC makes the graph appear to be
rising more slowly
b. Stock ABC shows the best performance. The scale of Stock ABC makes the graph appear to be
rising more slowly
C. Stock XYZ shows the best performance. The scale of Stock XYZ makes the graph appear to be
rising more slowly
d Stock ABC shows the best performance. The scale of Stock XYZ makes the graph appear to be
rising more slowly

Answers: 2
Other questions on the subject: Mathematics
Do you know the correct answer?
Questions in other subjects:

Chemistry, 22.05.2021 23:40

History, 22.05.2021 23:40


English, 22.05.2021 23:40
Mathematics, 22.05.2021 23:40


