

Mathematics, 23.04.2020 18:08, amandajennings01
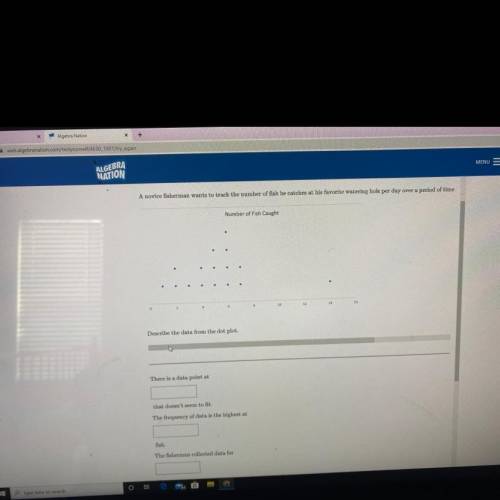
A novice fisherman wants to track the number of fish he catches at his favorite watering hole per day over a period of time. He created a dot plot of his results below.
There is a data point at _ that doesn’t seem to fit.
The frequency of data is the highest at _ fish.
The fisherman collected data for _ days.
The total number of fish caught is _ fish.

Answers: 3


Other questions on the subject: Mathematics
Mathematics, 21.06.2019 19:30, TheViperMlg23676
When 142 is added to a number the result is 64 more times the number my options are 35 37 39 41
Answers: 1
Do you know the correct answer?
A novice fisherman wants to track the number of fish he catches at his favorite watering hole per da...
Questions in other subjects:

Biology, 18.11.2019 12:31


Business, 18.11.2019 12:31


Physics, 18.11.2019 12:31
Mathematics, 18.11.2019 12:31


