

Mathematics, 22.04.2020 23:15, lukeperry
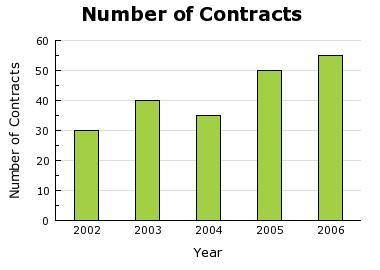
The bar graph shows the number of contracts Company X gained each year from 2002 to 2006. Over which of the periods was the average rate of increase for number of Contracts for Company X the smallest?
A) From 2002 through 2003
B) From 2002 through 2004
C) From 2004 through 2005
D) From 2004 through 2006

Answers: 3


Other questions on the subject: Mathematics
Mathematics, 22.06.2019 01:00, nicolew647
Which of the following is equal to the rational expression when x is not equal to -2 or -6?
Answers: 2
Mathematics, 22.06.2019 02:30, caprisun6779
Abby is collecting rainfall data. she finds that one value of the data set is a high-value outlier. which statement must be true? abby will use a different formula for calculating the standard deviation. the outlier will increase the standard deviation of the data set. the spread of the graph of the data will not change. abby will not use the mean when calculating the standard deviation.
Answers: 3
Do you know the correct answer?
The bar graph shows the number of contracts Company X gained each year from 2002 to 2006. Over which...
Questions in other subjects:
Mathematics, 19.03.2021 03:00


Mathematics, 19.03.2021 03:00


