

Mathematics, 22.04.2020 18:11, Nelly1828
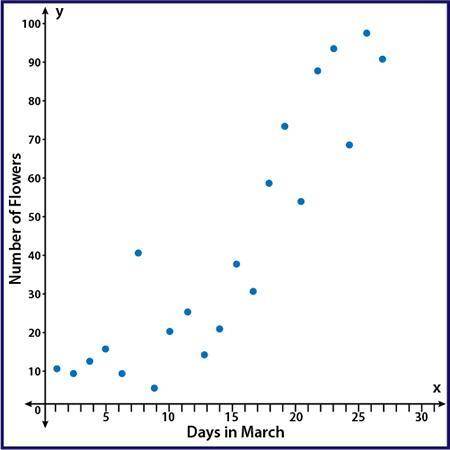
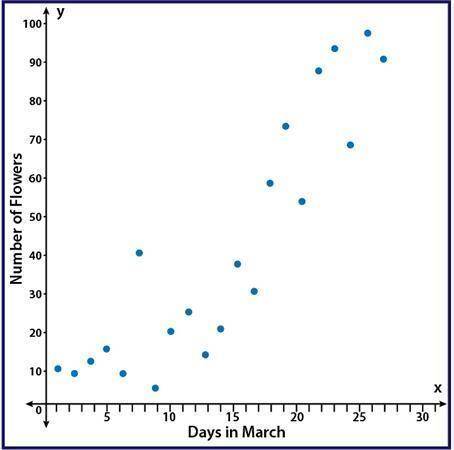
The scatter plot shows the number of flowers that have bloomed in the garden during the month of March:
Part A: Using computer software, a correlation coefficient of r = 0.98 was calculated. Based on the scatter plot, is that an accurate value for this data? Why or why not? (5 points)
Part B: Instead of comparing the number of flowers and the day in March, write a scenario that would be a causal relationship for flowers in a garden. (5 points)

Answers: 3


Other questions on the subject: Mathematics
Mathematics, 21.06.2019 19:30, jasminetaylor4587
According to the data set, where should the upper quartile line of the box plot be placed?
Answers: 1
Mathematics, 21.06.2019 22:20, jhonnysoriano9053
Select the correct answer from each drop-down menu. the table shows the annual sales revenue for different types of automobiles from three automobile manufacturers. sales revenue (millions of dollars) suv sedan truck marginal total b & b motors 22 15 9 46 pluto cars 25 27 10 62 panther motors 26 34 12 72 marginal total 73 76 31 180 the company with the highest percentage of sales revenue from sedans is . of the annual sales revenue from suvs, the relative frequency of pluto cars is .
Answers: 1
Do you know the correct answer?
The scatter plot shows the number of flowers that have bloomed in the garden during the month of Mar...
Questions in other subjects:


Mathematics, 01.10.2019 00:30

Geography, 01.10.2019 00:30

Physics, 01.10.2019 00:30


