


A small class took a survey of the number of siblings
each student has. The data are shown in...

Mathematics, 22.04.2020 17:25, jay13212
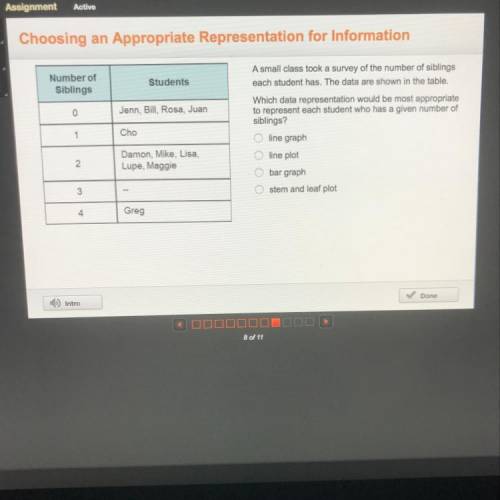
A small class took a survey of the number of siblings
each student has. The data are shown in the table.
Which data representation would be most appropriate
to represent each student who has a given number of
siblings?
line graph
line plot
bar graph
stem and leaf plot

Answers: 2
Other questions on the subject: Mathematics
Mathematics, 21.06.2019 17:00, jesicaagan
Find the value of the variable and the length of each secant segment.
Answers: 1
Mathematics, 21.06.2019 19:30, kklove6700
What is the result of adding the system of equations? 2x+y=4 3x-y=6
Answers: 2
Do you know the correct answer?
Questions in other subjects:
Mathematics, 11.01.2021 07:00
Mathematics, 11.01.2021 07:00

History, 11.01.2021 07:00


English, 11.01.2021 07:00
Mathematics, 11.01.2021 07:00

Mathematics, 11.01.2021 07:00
History, 11.01.2021 07:00


