


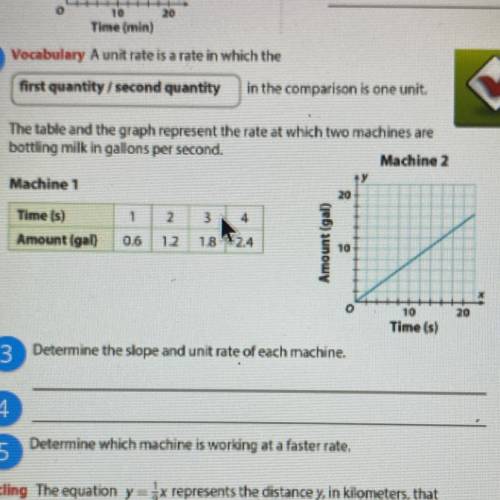
9. The table and the graph represent the'rate at which two machines are
bottling milk in gallo...

Mathematics, 22.04.2020 15:46, JamesLachoneus
9. The table and the graph represent the'rate at which two machines are
bottling milk in gallons per second.
Machine 2
Machine 1
Time is)
Amount Igal)
06
12
18
Amount (gal)
Time (s)
3
Determine the slope and unit rate of each machine.

Answers: 2
Other questions on the subject: Mathematics
Mathematics, 21.06.2019 21:00, natjojo0512
Rewrite the following quadratic functions in intercept or factored form. show your work. f(x) = 3x^2 - 12
Answers: 1
Mathematics, 22.06.2019 04:50, ian2006huang
What is the measure of dg? enter your answer in the box.
Answers: 1
Mathematics, 22.06.2019 05:30, nuconteaza119
To increase her number of students, the instructor put a coupon in the local paper offering to waive the one-time fee for new students. what is the value of the coupon?
Answers: 1
Mathematics, 22.06.2019 07:00, ohgeezy
The table and the graph each show a different relationship between the same two variables, x and y: a table with two columns and 5 rows is shown. the column head for the left column is x, and the column head for the right column is y. the row entries in the table are 3,240 and 4,320 and 5,400 and 6,480. on the right of this table is a graph. the x-axis values are from 0 to 10 in increments of 2 for each grid line. the y-axis values on the graph are from 0 to 350 in increments of 70 for each grid line. a line passing through the ordered pairs 2, 70 and 4, 140 and 6, 210 and 8, 280 is drawn. how much more would the value of y be in the table, than its value on the graph, when x = 11?
Answers: 2
Do you know the correct answer?
Questions in other subjects:

History, 17.01.2020 02:31
Mathematics, 17.01.2020 02:31

Arts, 17.01.2020 02:31
History, 17.01.2020 02:31
Mathematics, 17.01.2020 02:31


Social Studies, 17.01.2020 02:31
Mathematics, 17.01.2020 02:31
Social Studies, 17.01.2020 02:31


