

Mathematics, 27.08.2019 13:30, suselygonza
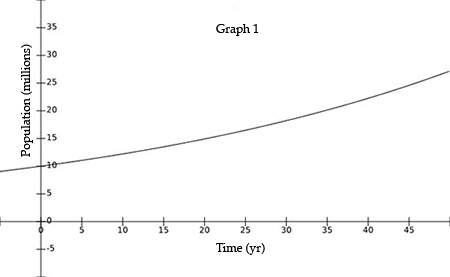
The future population of a small south american country of 10 million people can be modeled by the exponential equation p(t) = p0(e)0.02t, where p(t) is the future population in t years and p0 is the current population in millions of people.
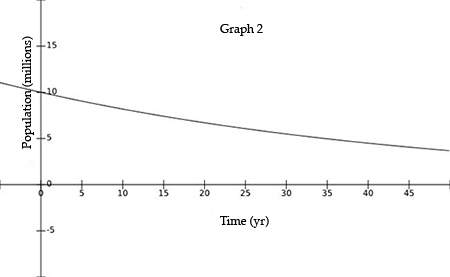
which of the following graphs represents this model, what is the expected population of this country (rounded to the nearest tenth of a million) in 40 years, and how long will it take (rounded to the nearest year) for the current population to reach 30 million?
graph 1, 21.7 million, 50 years
graph 2, 4.9 million, 30 years
graph 2, 4.5 million, the population will not reach 30 million because this graph is an exponential decay model
graph 1, 22.3 million, 55 years

Answers: 1


Other questions on the subject: Mathematics
Mathematics, 21.06.2019 17:20, ponylover9655
Read the situations in the table below. then drag a graph and equation to represent each situation. indicate whether each of the relationships is proportional or non-proportional. edit : i got the right answer its attached
Answers: 2
Mathematics, 21.06.2019 18:00, santosv3136
What are the equivalent ratios for 24/2= /3= /5.5=108/ = /15
Answers: 1
Mathematics, 21.06.2019 18:00, dlaskey646
The swimming pool is open when the high temperature is higher than 20∘c. lainey tried to swim on monday and thursday (which was 3 days later). the pool was open on monday, but it was closed on thursday. the high temperature was 30∘c on monday, but decreased at a constant rate in the next 3 days. write an inequality to determine the rate of temperature decrease in degrees celsius per day, d, from monday to thursday.
Answers: 1
Mathematics, 21.06.2019 18:50, xlebrny1215
Which translation maps the vertex of the graph of the function f(x) = x2 onto the vertex of the function g(x) = x2 – 10x +2?
Answers: 1
Do you know the correct answer?
The future population of a small south american country of 10 million people can be modeled by the e...
Questions in other subjects:

History, 14.07.2019 15:00

Biology, 14.07.2019 15:00
Mathematics, 14.07.2019 15:00

Biology, 14.07.2019 15:00


Health, 14.07.2019 15:00


