


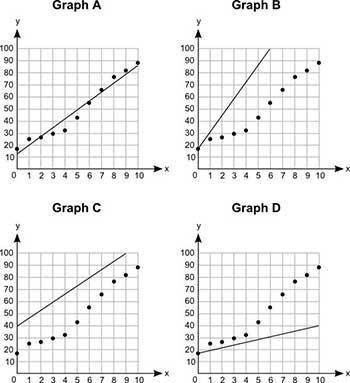
Four graphs are shown below:
Which graph best shows the line of best fit?
Gr...

Mathematics, 21.04.2020 23:19, angeljohnson2081
Four graphs are shown below:
Which graph best shows the line of best fit?
Graph A
Graph B
Graph C
Graph D

Answers: 2
Other questions on the subject: Mathematics
Mathematics, 21.06.2019 15:40, Prettygirlbuggy
Two parallel lines are crossed by a transversal. what is the value of x? x = 40 x = 70 x = 110 x = 130
Answers: 2
Mathematics, 21.06.2019 23:00, Pingkay7111
Which geometric principle is used to justify the construction below?
Answers: 1
Mathematics, 22.06.2019 00:30, citlalli30
Candice uses the function f(t)=t+100−−−−−−√ to model the number of students in her after-school program. the variable t represents days and f(t) represents the number of students. how many days does it take for there to be 15 students in her program? a. 225 days b. 125 days c. 325 days d. 115 days
Answers: 2
Do you know the correct answer?
Questions in other subjects:

History, 28.02.2021 08:40
Mathematics, 28.02.2021 08:40
Mathematics, 28.02.2021 08:40
Mathematics, 28.02.2021 08:40


Mathematics, 28.02.2021 08:40


