

Mathematics, 21.04.2020 22:17, xinkyx616
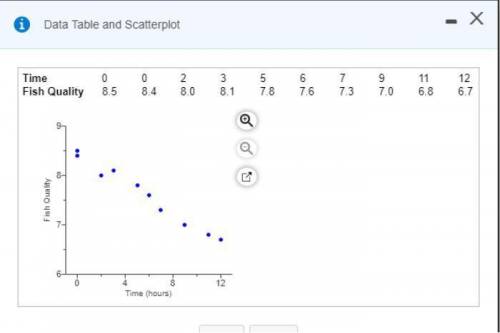
In a study conducted to examine the quality of fish after 7 days in ice storage, ten raw fish of the same kind and approximately the same size were caught and prepared for ice storage. The fish were placed in ice storage at different times after being caught. A measure of fish quality was given to each fish after 7 days in ice storage. Review the accompanying sample data and scatterplot, where "Time" is the number of hours after being caught that the fish was placed in ice storage and "Fish Quality" is the measure given to each fish after 7 days in ice storage (higher numbers mean better quality). Is it appropriate to use the correlation coefficient to describe the strength of the relationship between "Time" and "Fish Quality"?

Answers: 2


Other questions on the subject: Mathematics
Mathematics, 21.06.2019 20:30, Gabyngreen
What is the interquartile range of this data set? 2, 5, 9, 11, 18, 30, 42, 48, 55, 73, 81
Answers: 1
Do you know the correct answer?
In a study conducted to examine the quality of fish after 7 days in ice storage, ten raw fish of the...
Questions in other subjects:


English, 27.09.2021 07:20
Mathematics, 27.09.2021 07:20

French, 27.09.2021 07:20
Mathematics, 27.09.2021 07:20

Mathematics, 27.09.2021 07:20
Biology, 27.09.2021 07:20


