


The data in the table represent the height of an object over time.
A 2-column table with...

Mathematics, 21.04.2020 17:37, mcadoo6634
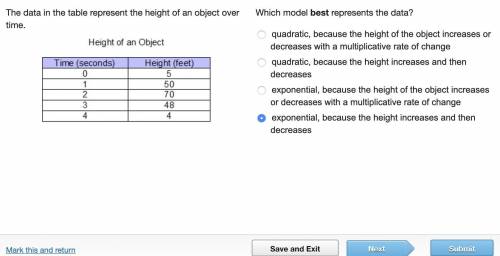
The data in the table represent the height of an object over time.
A 2-column table with 5 rows. The first column is labeled time (seconds) with entries 0, 1, 2, 3, 4. The second column is labeled height (feet) with entries 5, 50, 70, 48, 4.
Which model best represents the data?
quadratic, because the height of the object increases or decreases with a multiplicative rate of change
quadratic, because the height increases and then decreases
exponential, because the height of the object increases or decreases with a multiplicative rate of change
exponential, because the height increases and then decreases

Answers: 2
Other questions on the subject: Mathematics
Mathematics, 22.06.2019 04:20, GreenHerbz206
If there are 825 students at cherry hill high school and 4 out of every 5 students voted in the student council election, how many students voted?
Answers: 2
Mathematics, 22.06.2019 04:40, lisbethtsu5309
Find the solution of this system of equations -7x+y=-20 9x-3y=36
Answers: 2
Mathematics, 22.06.2019 05:00, maxicanofb0011
Akindergarten class has 9 girls and 11 boys in class. what percent of the class are girlsit rain
Answers: 1
Do you know the correct answer?
Questions in other subjects:


