


1 point
2. The graph below represents the number of hours students spent
working on a cl...

Mathematics, 21.04.2020 10:17, kaylarenee05080
1 point
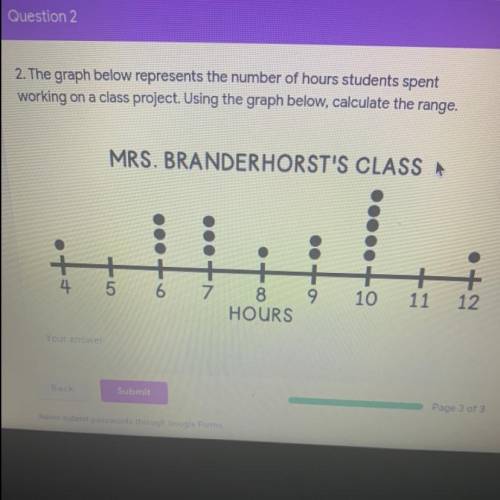
2. The graph below represents the number of hours students spent
working on a class project. Using the graph below, calculate the range.
Look at the image for the graph please and Thank you !

Answers: 1
Other questions on the subject: Mathematics
Mathematics, 21.06.2019 15:10, sunshine52577oyeor9
Which of the following is a proper fraction? a. 9⁄8 b. 5⁄6 c. 7⁄3 d. 4⁄2
Answers: 2
Mathematics, 21.06.2019 15:50, aidanfbussiness
If the dimensions of a rectangular prism are 5 ft x 3.5 ft x 2 ſt, what is the surface area?
Answers: 1
Do you know the correct answer?
Questions in other subjects:

Physics, 24.12.2020 01:30

Biology, 24.12.2020 01:30

Physics, 24.12.2020 01:40

History, 24.12.2020 01:40
Mathematics, 24.12.2020 01:40


