


The following data set represents the number of students in the Tuesday
trampoline classes. Wh...

Mathematics, 21.04.2020 10:17, gunnatvinson
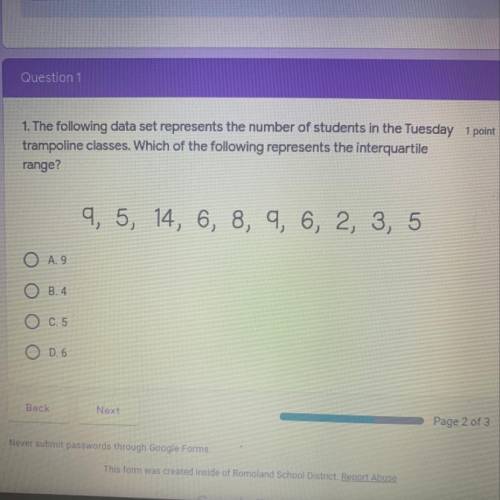
The following data set represents the number of students in the Tuesday
trampoline classes. Which of the following represents the interquartile range?
9, 5, 14, 6, 8, 9, 6, 2, 3, 5

Answers: 3
Other questions on the subject: Mathematics
Mathematics, 21.06.2019 16:00, jeff7259
The scatter plot graph shows the average annual income for a certain profession based on the number of years of experience which of the following is most likely to be the equation of the trend line for this set of data? a. i=5350e +37100 b. i=5350e-37100 c. i=5350e d. e=5350e+37100
Answers: 1
Mathematics, 21.06.2019 19:30, amatulli
Abird on top of a 200 ft bridge tower sees a man standing on the lower part of the bridge (which is 50 ft above the ground). the angle of depression from the bird is 26 ̊. how far is the man from the base of the bridge tower? with explanation and pictures .
Answers: 1
Do you know the correct answer?
Questions in other subjects:
Mathematics, 18.10.2019 09:30

Computers and Technology, 18.10.2019 09:30


Biology, 18.10.2019 09:30
Mathematics, 18.10.2019 09:30


