

Mathematics, 19.04.2020 19:22, aylinkayla
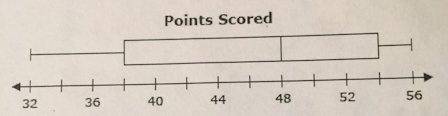
The box-and-whisker plot represents the number of points scored by teams in a soccer league last year.
A) What are the range, interquartile range, and median of the box-and-whisker plot?
B) The league commissioner believes about half of the teams in the league scored 48 points of more last year. Use the Graph to explain whether this is reasonable.
C) If the box-and-whisker plot represented data from 20 teams, about how many of the teams scored between 38 and 48 points? Explain.

Answers: 1


Other questions on the subject: Mathematics
Mathematics, 21.06.2019 13:30, adreyan3479
Combined megan and kelly worked 60 hours. kelly worked twice as many hours as megan. how many hours did they each worked?
Answers: 3
Do you know the correct answer?
The box-and-whisker plot represents the number of points scored by teams in a soccer league last yea...
Questions in other subjects:
Mathematics, 23.12.2020 09:10

Health, 23.12.2020 09:10

Chemistry, 23.12.2020 09:10
Mathematics, 23.12.2020 09:10
Mathematics, 23.12.2020 09:10
Mathematics, 23.12.2020 09:10

Arts, 23.12.2020 09:10

Biology, 23.12.2020 09:10
Arts, 23.12.2020 09:10

Computers and Technology, 23.12.2020 09:10


