

Mathematics, 19.04.2020 05:56, qorderiusnewton
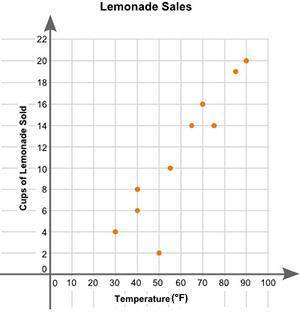
Eric plotted the graph below to show the relationship between the temperature of his city and the number of cups of lemonade he sold daily: (PICTURE BELOW)
Part A: Describe the relationship between the temperature of the city and the number of cups of lemonade sold. (2 points)
Part B: Describe how you can make the line of best fit. Write the approximate slope and y-intercept of the line of best fit. Show your work, including the points that you use to calculate the slope and y-intercept. (3 points)

Answers: 2


Other questions on the subject: Mathematics
Mathematics, 21.06.2019 19:30, taylor511176
Celeste wants to have her hair cut and permed and also go to lunch. she knows she will need $50. the perm cost twice as much as her haircut and she needs $5 for lunch. how much does the perm cost?
Answers: 1
Mathematics, 21.06.2019 20:50, karaisabelhill
Find the missing variable for a parallelogram: a = latex: 32in^2 32 i n 2 h = b = 6.3 in (1in=2.54cm)
Answers: 2
Mathematics, 21.06.2019 23:20, lyss12326
Sophia wrote an equation to represent the revenue of a movie theater for one day. she let x represent the number of child tickets sold and y represents the nunver of adult tickets sold. if a child ticket cost $4, an adult ticket cost $6, and the total revenue for the daybwas $420, which equation could sophia use to represent the number of chikd and adult tickets that were sold?
Answers: 1
Do you know the correct answer?
Eric plotted the graph below to show the relationship between the temperature of his city and the nu...
Questions in other subjects:

Mathematics, 10.06.2021 01:00
Mathematics, 10.06.2021 01:00


Engineering, 10.06.2021 01:00
Mathematics, 10.06.2021 01:00

Social Studies, 10.06.2021 01:00


