

Mathematics, 19.04.2020 05:49, emilylol04173
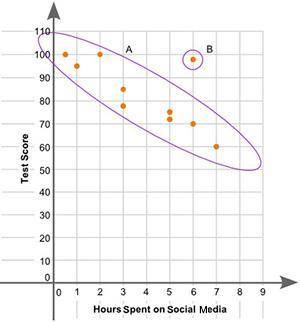
The scatter plot shows the relationship between the test scores of a group of students and the number of hours they spend on social media in a week:
Part A: What is the group of points labeled A called? What is the point labeled B called? Give a possible reason for the presence of point B. (3 points)
Part B: Describe the association between a student’s test scores and the number of hours spent on social media. (2 points)

Answers: 1


Other questions on the subject: Mathematics
Do you know the correct answer?
The scatter plot shows the relationship between the test scores of a group of students and the numbe...
Questions in other subjects:


Social Studies, 19.05.2021 22:50
Mathematics, 19.05.2021 22:50


Mathematics, 19.05.2021 22:50

Biology, 19.05.2021 22:50


