


Me!
dylan created color panels for a wall using a mix of only green and blue paints. he plott...

Mathematics, 20.09.2019 18:00, queenjay34
Me!
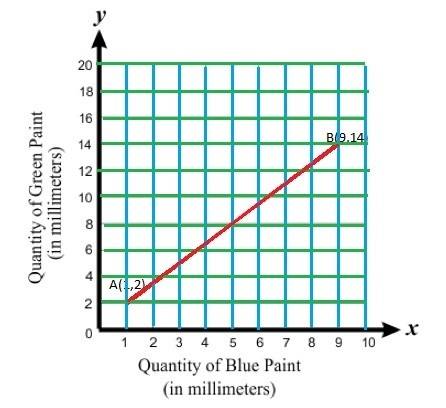
dylan created color panels for a wall using a mix of only green and blue paints. he plotted the quantities of blue and green paints used for each mix and connected them using a line segment, as shown in the graph below:
line graph color mix, quantity of blue paint, in mm, the x axis and quantity of green paint, in mm, the y axis. x axis has a scale from 0 to 10 increments of 1. y axis has a scale of 0 to 20 increments of 2. straight line 1, 2 and 9, 14 is drawn
which statement best describes the domain of the function represented in the graph?
0 ≤ x ≤ 9 or x is between 0 and 9, inclusive
2 ≤ x ≤ 14 or x is between 2 and 14, inclusive
1 ≤ x ≤ 9 or x is between 1 and 9, inclusive
1 ≤ x ≤ 14 or x is between 1 and 14, inclusive

Answers: 2
Other questions on the subject: Mathematics
Mathematics, 21.06.2019 12:50, 2022mcwhirterbrendan
Solve the system by the elimination method. 2x + y - 4 = 0 2x - y - 4 = 0 when you eliminate y, what is the resulting equation? a. x = 0 b.4x = -8 c.4x = 8
Answers: 1
Mathematics, 21.06.2019 18:00, isaiahcannon5709
Use the data on the dot plot to answer the question. how many people read for more than three hours last week? i'm on a unit test review
Answers: 1
Do you know the correct answer?
Questions in other subjects:

History, 12.07.2019 03:00

Mathematics, 12.07.2019 03:00
Mathematics, 12.07.2019 03:00
Biology, 12.07.2019 03:00


English, 12.07.2019 03:00
Mathematics, 12.07.2019 03:00


