

Mathematics, 17.04.2020 19:55, itryna1
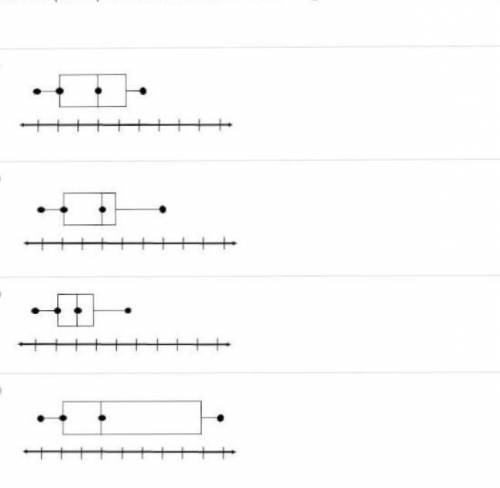
Which box plot represents a set of data that has the greatest mean absolute deviation? (see attached image)

Answers: 2


Other questions on the subject: Mathematics
Mathematics, 21.06.2019 14:00, heatherswiffin666
Rewrite the following without an exponent. (5/8)-1
Answers: 1
Mathematics, 21.06.2019 17:10, sujeyribetanco2216
The average number of vehicles waiting in line to enter a parking lot can be modeled by the function f left parenthesis x right x squared over 2 left parenthesis 1 minus x right parenthesis endfraction , where x is a number between 0 and 1 known as the traffic intensity. find the rate of change of the number of vehicles waiting with respect to the traffic intensity for the intensities (a) xequals0.3 and (b) xequals0.6.
Answers: 1
Mathematics, 21.06.2019 18:00, whocares1234
How many triangles can be drawn with side lengths 4 centimeters, 4.5 centimeters, and 9 centimeters? explain
Answers: 1
Mathematics, 21.06.2019 18:20, mairealexander87
The total cost of anja’s trip to the dentist was $628.35. she paid a flat fee of $89.95 which included the checkup and cleaning and then had 4 cavities filled, each of which cost the same amount. which shows the correct equation and value of x, the cost of each cavity filling?
Answers: 2
Do you know the correct answer?
Which box plot represents a set of data that has the greatest mean absolute deviation? (see attached...
Questions in other subjects:


History, 11.11.2020 17:50
History, 11.11.2020 17:50


