


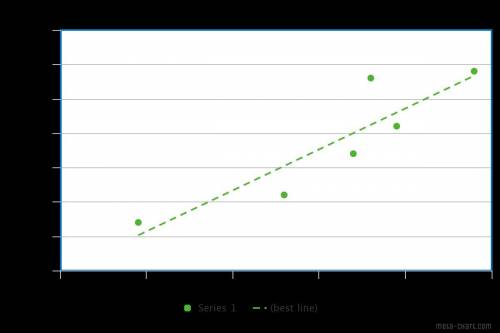
Here's a better view of the chart https://www. meta-chart. com/share/506-assignment-3
The y ax...

Mathematics, 17.04.2020 00:04, mparra4761
Here's a better view of the chart https://www. meta-chart. com/share/506-assignment-3
The y axis is height and the x axis is arm span
1. Which variable did you plot on the x-axis, and which variable did you plot on the y-axis? Explain why you assigned the variables in that way.
2. Write the equation of the line of best fit using the slope-intercept formula y = mx + b. Show all your work, including the points used to determine the slope and how the equation was determined.
3. What does the slope of the line represent within the context of your graph? What does the y-intercept represent?
4. Test the residuals of two other points to determine how well the line of best fit models the data.
5. Use the line of best fit to help you to describe the data correlation.
6. Using the line of best fit that you found in Part Three, Question 2, approximate how tall is a person whose arm span is 66 inches?
7. According to your line of best fit, what is the arm span of a 74-inch-tall person?

Answers: 2
Other questions on the subject: Mathematics
Mathematics, 21.06.2019 15:30, adriana145
With these: 18/36 = 1/? missing number change 1 5/8 to improper fraction. change 19/5 to a mixed number.
Answers: 3
Mathematics, 21.06.2019 22:30, winterblanco
How do you do the foil method with polynomials?
Answers: 1
Mathematics, 22.06.2019 00:00, MarMarMar07
Vinny is interviewing for a job. he wants his take home pay to be at least $42,000.what is the least salary he can earn if he pays 25% income tax?
Answers: 2
Do you know the correct answer?
Questions in other subjects:

Mathematics, 11.07.2019 23:30

Mathematics, 11.07.2019 23:30
Mathematics, 11.07.2019 23:30

World Languages, 11.07.2019 23:30

Health, 11.07.2019 23:30


