


The box plots show the average wind speeds, in miles per hour, for two different islands.
Aver...

Mathematics, 16.04.2020 08:23, hannahdrumsey
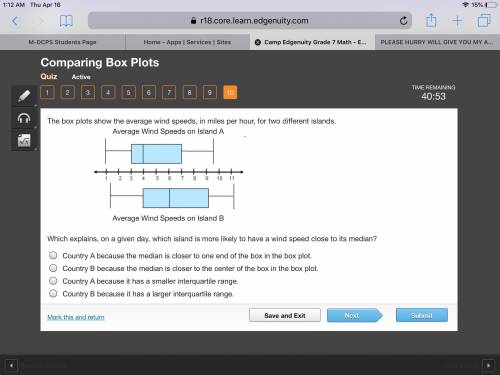
The box plots show the average wind speeds, in miles per hour, for two different islands.
Average Wind Speeds on Island A
2 box plots. The number line goes from 1 to 11. For the average wind speeds of cities on Island A, the whiskers range from 1 to 9.5, and the box ranges from 3 to 7. A line divides the box at 4. For the average wind speeds of cities on Island B, the whiskers range from 1.5 to 11, and the box ranges from 4 to 9. A line divides the box at 6.
Average Wind Speeds on Island B
Which explains, on a given day, which island is more likely to have a wind speed close to its median?
Country A because the median is closer to one end of the box in the box plot.
Country B because the median is closer to the center of the box in the box plot.
Country A because it has a smaller interquartile range.
Country B because it has a larger interquartile range.

Answers: 3
Other questions on the subject: Mathematics
Mathematics, 21.06.2019 17:30, corinaartsy
Match each function with its rate of growth or decay
Answers: 1
Mathematics, 21.06.2019 19:30, ray2220
The position of a moving particle is given by the position function: f(t)=-9t-t^2-0.2t^3+0.1t^4 a. at what time does the particle reverse direction? b. when is the displacement positive? (round one decimal place and answer in interval notation) c. when is the displacement negative? (round one decimal place and answer in interval notation) d. when is the particle’s acceleration positive? (round one decimal place and answer in interval notation) e. when is the particle’s acceleration negative? (round one decimal place and answer in interval notation)
Answers: 3
Do you know the correct answer?
Questions in other subjects:

English, 18.07.2019 23:30

English, 18.07.2019 23:30


