


Here are the 30 best lifetime baseball batting averages of all time, arranged in
order from lo...

Mathematics, 16.04.2020 04:16, erica11223344
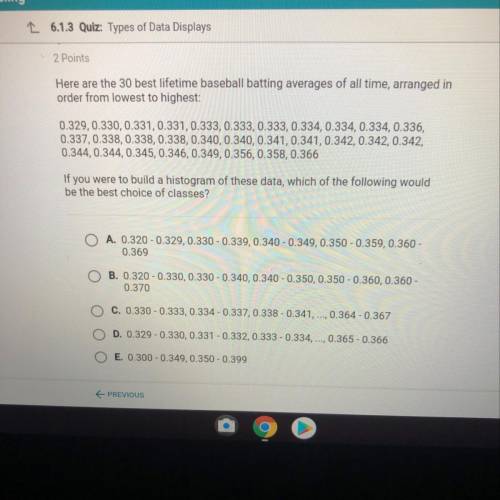
Here are the 30 best lifetime baseball batting averages of all time, arranged in
order from lowest to highest:
0.329,0.330,0.331,0.331,0.333,0.333 , 0.333, 0.334, 0.334, 0.334, 0.336,
0.337, 0.338, 0.338, 0.338, 0.340,0.340, 0.341, 0.341, 0.342, 0.342, 0.342,
0.344, 0.344,0.345, 0.346, 0.349, 0.356, 0.358, 0.366
If you were to build a histogram of these data, which of the following would
be the best choice of classes?

Answers: 3
Other questions on the subject: Mathematics
Mathematics, 21.06.2019 22:10, Jenifermorales101
Write the function for the graph. (1.8) (0,4)
Answers: 3
Mathematics, 21.06.2019 23:00, tonimgreen17p6vqjq
Which graph represents the linear function below? y-3=1/2(x+2)
Answers: 2
Mathematics, 22.06.2019 00:00, keshjdjsjs
The graph shows the decibel measure for sounds depending on how many times as intense they are as the threshold of sound. noise in a quiet room is 500 times as intense as the threshold of sound. what is the decibel measurement for the quiet room? 20 decibels28 decibels200 decibels280 decibels
Answers: 1
Do you know the correct answer?
Questions in other subjects:
Mathematics, 13.07.2019 23:20
Mathematics, 13.07.2019 23:20

History, 13.07.2019 23:20


