

Mathematics, 16.04.2020 02:25, cam6836
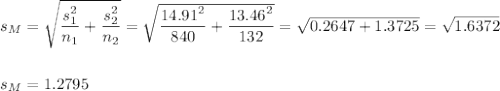
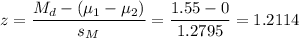
Weight gain during pregnancy. In 2004, the state of North Carolina released to the public a large data set containing information on births recorded in this state. This data set has been of interest to medical researchers who are studying the relationship between habits and practices of expectant mothers and the birth of their children. The following histograms show the distributions of weight gain during pregnancy by 840 younger moms (less than 35 years old) and 132 mature moms (35 years old and over) who have been randomly sampled from this large data set. The average weight gain of younger moms is 30.7 pounds, with a standard deviation of 14.91 pounds, and the average weight gain of mature moms is 29.15 pounds, with a standard deviation of 13.46 pounds. Do these data provide strong evidence that there is a significant difference between the two population means? Conduct a hypothesis test. Round all numeric answers to 4 decimal places.1. Which set of hypotheses should the researcher use?
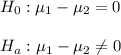
A. H0H0: p1−p2=0p1−p2=0, HAHA: p1−p2<0p1−p2<0
B. H0H0: μ1−μ2=0μ1−μ2=0, HAHA: μ1−μ2≠0μ1−μ2≠0
C. H0H0: p1−p2=0p1−p2=0, HAHA: p1−p2≠0p1−p2≠0
D. H0H0: μ1−μ2=0μ1−μ2=0, HAHA: μ1−μ2>0μ1−μ2>0
2. Calculate the test statistic. ? z t X^2 F =
3. Calculate the p-value for this hypothesis test.
p value =
4. What is your conclusion using αα = 0.01?
A. Do not reject H0H0
B. Reject H0H0

Answers: 3


Other questions on the subject: Mathematics
Mathematics, 21.06.2019 14:00, lashayreed02
Tracy solved the following problem. which of the statements is true? 9 ÷ 3 + 6 × 2 3 + 6 × 2 9 × 2 18 her answer is correct. her answer is incorrect. she should have multiplied before dividing. her answer is incorrect. she should have multiplied before adding. her answer is incorrect. she should have added before dividing.
Answers: 1
Mathematics, 21.06.2019 21:30, girlysimbelieve
Aroulette wheel has 38 slots in which the ball can land. two of the slots are green, 18 are red, and 18 are black. the ball is equally likely to land in any slot. the roulette wheel is going to be spun twice, and the outcomes of the two spins are independent. the probability that it lands one time on red and another time on black in any order is(a) 0.5 (b) 0.25 (c) 0.4488 (d) 0.2244
Answers: 1
Do you know the correct answer?
Weight gain during pregnancy. In 2004, the state of North Carolina released to the public a large da...
Questions in other subjects:

Mathematics, 06.04.2021 18:50

French, 06.04.2021 18:50

Mathematics, 06.04.2021 18:50
Chemistry, 06.04.2021 18:50
Mathematics, 06.04.2021 18:50

Mathematics, 06.04.2021 18:50


