


(this question is for image number 2)
1.The following dot plot represents a random sampl...

Mathematics, 15.04.2020 17:26, darrengresham999
(this question is for image number 2)
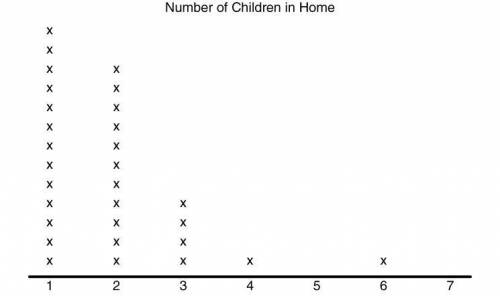
1.The following dot plot represents a random sample of elementary students and the number of children that live in their home.
Part 1: What is the range of the data set?
Part 2: What is the interquartile range of the data set?
Part 3: What is the mean absolute deviation of the data set? [Round both the mean and the mean absolute deviation to the nearest tenth.]
2.The following dot plot represents a random sample of elementary students and the number of children that live in their home.
Calculate the measures of central tendency for this set of data. Which of the following statements is NOT true?
a. The mean is closer in value to the mode than to the median.
b. The median is the largest measure of central tendency.
c. The median is greater than the mode.
d. The mode is less than the mean.
(questions for image 1)
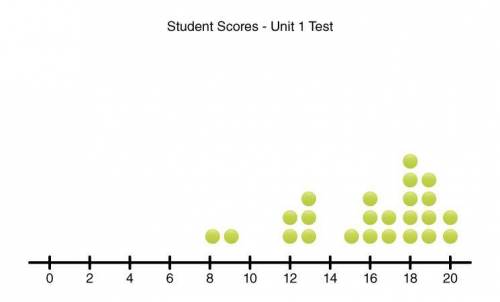
1.The following dot plot represents student scores on the Unit 1 math test. Scores are in whole number increments. If the test was out of 20 points, about what percentage of the students scored at least 80% on the test?
a.48%
b.67%
c.17%
d.12%
2.The following dot plot represents student scores on the Unit 1 math test. Scores are in whole number increments.
Part 1: What is the mean score, rounded to the nearest whole number?
Part 2: What is the median score?
Part 3: What is the mode score?
3.The following dot plot represents student scores on the Unit 1 math test. Scores are in whole number increments.
For this data set, the value of the range is about(CHOOSE: the same as or triple, or twice) the value of the interquartile range.
On average, the data points lie between(CHOOSE: 3 and 4 or 5 and 6 or 1 and 2 or 2 and 3 or 4 and 5) points from the mean.
HELP MEH ASAP

Answers: 1
Other questions on the subject: Mathematics
Mathematics, 21.06.2019 17:30, lexusdixon3
Sheila wants to bake six muffins but the recipe is for 12 muffins . this means you only need half of the ingredients listed how much of the of each ingredient does she need? one cup and banana chips ,7 tablespoons oil , two eggs, 3/4 cups flour 1/4 cup walnuts show all you work and justify your answer using a baby toulmin.
Answers: 3
Mathematics, 21.06.2019 18:00, leysirivera23ovez6n
The price of an item has been reduced by 30%. the original price was $30. what is the price of the item now ?
Answers: 1
Mathematics, 21.06.2019 20:30, strodersage
Ametal rod is 2/5 meters long. it will be cut into pieces that are each 1/30 meters long. how many pieces will be made from the rod?
Answers: 1
Do you know the correct answer?
Questions in other subjects:


History, 16.07.2021 19:00

English, 16.07.2021 19:00
Mathematics, 16.07.2021 19:00

Mathematics, 16.07.2021 19:10


