


Enter values for x and y in the table to plot points in the
raph.
These data points repr...

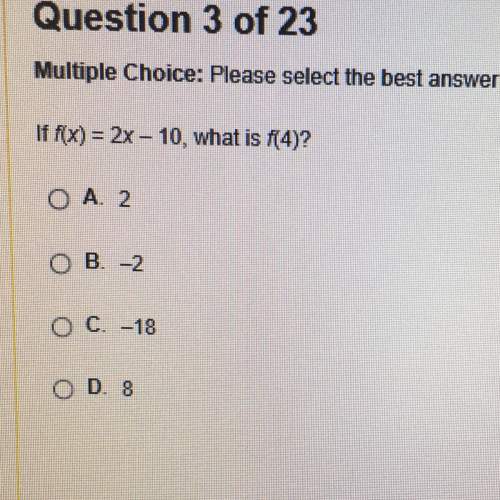
Mathematics, 15.04.2020 04:19, amorenextdoor
Enter values for x and y in the table to plot points in the
raph.
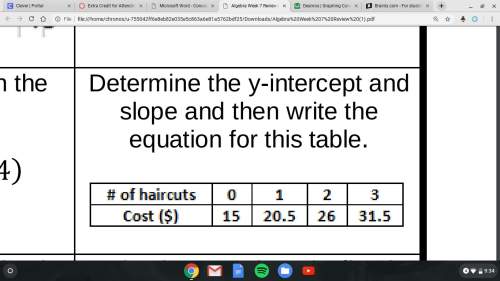
These data points represent the relationship between
the size of a house (in 1000 square feet) and its price
(in $100,000)
3.6
3.2
(1.2, 1.7), (1.4, 2), (1.5, 2.2), (1.6, 2.3), (1.8, 2.5), (1.9,
2.6), (2.1, 2.9), (2.2, 2.8), (2.4, 3.4), (2.7, 3.1)
2.8
2.4
Use the trend line to predict the cost of a 2,000-square-
foot house.
1.6
1.2
1.6
2
2.4
2.8
3.2
3.6
Intro
Done

Answers: 2
Other questions on the subject: Mathematics
Mathematics, 21.06.2019 17:00, valeriekbueno
100 points, hi, i’m not sure how to get the equation from the graph and table.
Answers: 2
Mathematics, 21.06.2019 21:00, daynafish13
Which expressions are equivalent to -7+3(-4e-3)? choose all answers that apply: choose all answers that apply: a -4(3e+4)? 4(3e+4) b 12e12e c none of the above
Answers: 2
Do you know the correct answer?
Questions in other subjects:
Mathematics, 10.11.2020 01:00

Biology, 10.11.2020 01:00

History, 10.11.2020 01:00
History, 10.11.2020 01:00

Spanish, 10.11.2020 01:00

English, 10.11.2020 01:00
History, 10.11.2020 01:00
Mathematics, 10.11.2020 01:00
Mathematics, 10.11.2020 01:00


