


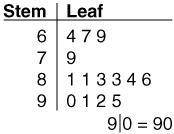
Which set of data could have been used to create the stem-and-leaf plot shown below?
64,...

Mathematics, 15.04.2020 02:30, paigesyring
Which set of data could have been used to create the stem-and-leaf plot shown below?
64, 79, 95, 83, 81, 90, 67, 86, 91, 84, 81, 69, 83, 92
6.4, 7.9, 9.5, 8.3, 8.1, 9.0, 6.7, 8.6, 9.1, 8.4, 8.1, 6.9, 8.3, 9.2
63, 79, 95, 83, 81, 90, 67, 86, 91, 84, 81, 69, 83, 92
6.3, 7.9, 9.5, 8.3, 8.1, 9.0, 6.7, 8.6, 9.1, 8.4, 8.1, 6.9, 8.3, 9.2

Answers: 2
Other questions on the subject: Mathematics
Mathematics, 21.06.2019 16:30, jayjay5246
Translate this phrase into an algebraic expression. 21 more than twice goran's savings use the variable g to represent goran's savings. need to know fast.
Answers: 1
Do you know the correct answer?
Questions in other subjects:

English, 13.08.2020 20:01


