

Mathematics, 15.04.2020 01:19, lexipiper8296
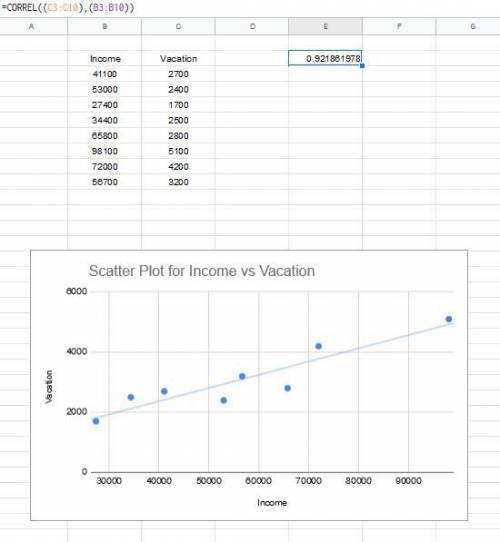
The following table shows the annual income, in dollars, and amount spent on vacation, in dollars, for a sample of 8 families.
Income 41,100 53,000 27,400 34,400 65,800 98,100 72,000 56,700
Vacation 2,700 2,400 1,700 2,500 2,800 5,100 4,200 3,200
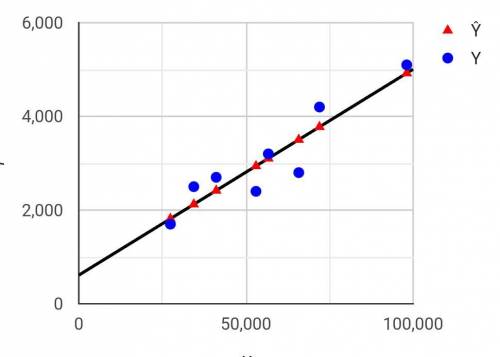
(a) Create a scatterplot of the data in the table.
(b) Describe the association shown in the scatterplot created in part (a).
(c) Calculate the coefficient of determination for the data, and interpret the value in context.

Answers: 3
![r=\frac{n(\sum xy)-(\sum x)(\sum y)}{\sqrt{[n\sum x^2-(\sum x)^2][n\sum y^2-(\sum y)^2}}\\\\\\\sum xy=153914\\\sum x=4485\\\sum y=246\\\sum x^2=2878447\\(\sum x)^2=4485^2=20115225\\(\sum y)^2=246^2=60516\\\sum y^2=8392\\n=8\\\\\#substitute \ and \ solve \ for \ r\\\\=\frac{8\times153914-4485\times 246}{\sqrt{[8\times 2878447-4485^2][8\times 8392-246^2]}}\\\\=0.92186\\\\\approx 0.9219](/tpl/images/0600/5176/3852f.png)


Other questions on the subject: Mathematics
Mathematics, 21.06.2019 16:30, chmereaustin1
An empty bucket is placed under a faucet dripping at a constant rate of 4 milliliters per minute. with the given information, which of these statements is a reasonable conclusion? a there will be 24 milliliters of water in the bucket after 16 hour. b there will be 60 milliliters of water in the bucket after 14 hour. c there will be 160 milliliters of water in the bucket after 20 minutes. d there will be 100 milliliters of water in the bucket after 40 minutes.
Answers: 1
Mathematics, 21.06.2019 19:00, niquermonroeee
Human body temperatures have a mean of 98.20° f and a standard deviation of 0.62°. sally's temperature can be described by z = 1.4. what is her temperature? round your answer to the nearest hundredth. 99.07°f 97.33°f 99.60°f 100.45°f
Answers: 1
Mathematics, 21.06.2019 20:00, JOEFRESH10
The table shows the age and finish time of ten runners in a half marathon. identify the outlier in this data set. drag into the table the ordered pair of the outlier and a reason why that point is an outlier.
Answers: 1
Do you know the correct answer?
The following table shows the annual income, in dollars, and amount spent on vacation, in dollars, f...
Questions in other subjects:
Mathematics, 03.08.2021 01:20

Chemistry, 03.08.2021 01:20

Social Studies, 03.08.2021 01:20


Spanish, 03.08.2021 01:20

Computers and Technology, 03.08.2021 01:20


