

Mathematics, 14.04.2020 18:55, jaida03
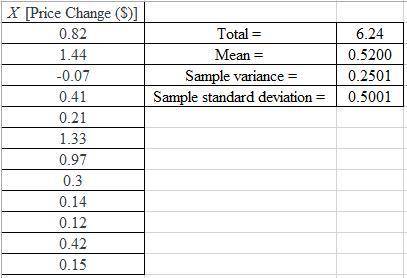
The table showing the stock price changes for a sample of 12 companies on a day is contained in the Excel file below.
Price Change ($)
0.82
1.44
-0.07
0.41
0.21
1.33
0.97
0.30
0.14
0.12
0.42
0.15
Construct a spreadsheet to answer the following questions.
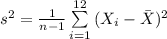
a. Compute the sample variance for the daily price change (to 4 decimals).
b. Compute the sample standard deviation for the price change (to 4 decimals).
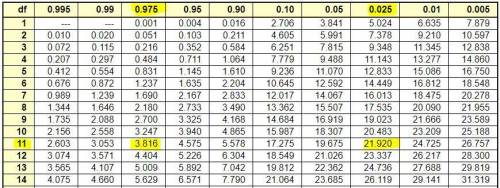
c. Provide 95% confidence interval estimates of the population variance (to 4 decimals).

Answers: 1

 =AVERAGE(A2:A13)
 =VAR.S(A2:A13)
 =STDEV.S(A2:A13)
![CI=[\frac{(n-1)s^{2}}{\chi^{2}_{\alpha/2} } \leq \sigma^{2}\leq \frac{(n-1)s^{2}}{\chi^{2}_{1-\alpha/2} } ]](/tpl/images/0598/7478/a42f6.png)


![=[\frac{(12-1)\times 0.2501}{21.920 } \leq \sigma^{2}\leq \frac{(12-1)\times 0.2501}{3.816} ]](/tpl/images/0598/7478/f887c.png)
![=[0.125506\leq \sigma^{2}\leq 0.720938]\\\approx [0.1255, 0.7210]](/tpl/images/0598/7478/e0a86.png)


Other questions on the subject: Mathematics
Mathematics, 21.06.2019 18:30, galaxychild101
The clayton family’s pool has vertices at the coordinates (0, 2), (0, 5), (2, 5), (2, 6), (5, 6), (5, 1), (2, 1), and (2, 2). if each grid square has an area of 9 square feet, what is the area of the pool?
Answers: 1
Mathematics, 21.06.2019 23:00, teriateria
How can writing phrases as algebraic expressions you solve problems?
Answers: 2
Mathematics, 21.06.2019 23:20, amylumey2005
The following hormone had their receptors in the cell membrane except a-insulin b-tsh c-gh d- cortisol
Answers: 2
Do you know the correct answer?
The table showing the stock price changes for a sample of 12 companies on a day is contained in the...
Questions in other subjects:


Social Studies, 25.06.2019 09:00
Mathematics, 25.06.2019 09:00
Social Studies, 25.06.2019 09:00

Biology, 25.06.2019 09:00


