

Mathematics, 13.10.2019 01:30, emilycabrera610
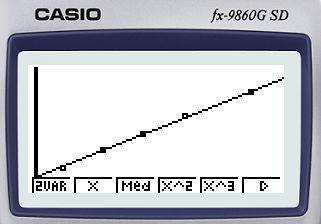
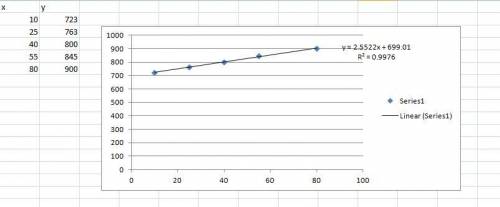
The data in the table below represents the pressure of the gas as the temperature changes. plot a graph of this data. draw a trend line and calculate its slope. how are the variables related? what will the pressure of the gas be at 0°c? the data is: . temp(c): 10, 25, 40, 55, 80. pressure (torr): 723, 763, 800, 845, 900.

Answers: 2


Other questions on the subject: Mathematics
Mathematics, 21.06.2019 20:30, raemyiajackson1
Find the value of x. give reasons to justify your solutions! h ∈ ig
Answers: 1
Do you know the correct answer?
The data in the table below represents the pressure of the gas as the temperature changes. plot a gr...
Questions in other subjects:


Biology, 06.12.2019 23:31


