


es )

Mathematics, 11.04.2020 01:32, pado4776
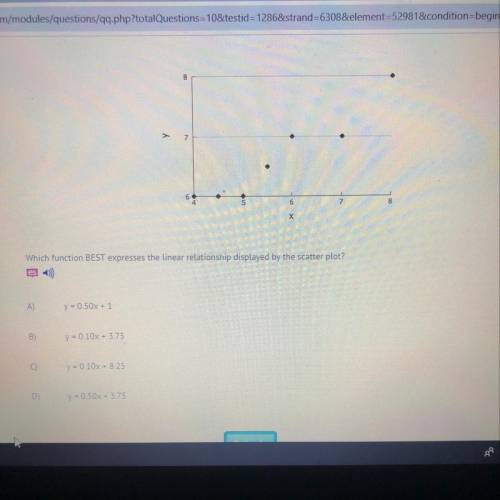
Which function BEST expresses the linear relationship displayed by the scatter plot?
es )
A) y=0.50x+1
B)y=0.10x+3.75
C)y=0.10x+8.25
D)y=0.50x+3.75

Answers: 2
Other questions on the subject: Mathematics
Mathematics, 21.06.2019 21:50, smithsa10630
What is the 17th term in the arithmetic sequence in which a6 is 101 and a9 is 83
Answers: 1
Mathematics, 22.06.2019 00:00, AnonymousLizard52303
The probability that a tutor will see 0, 1, 2, 3, or 4 students is given below determine the probability distribution's missing value.
Answers: 1
Mathematics, 22.06.2019 00:30, swaggsuperman713
(i really need ) read the story problem, and then answer the questions that follow. gordon works for a graphic design firm and is creating a label for a food truck vendor. the vendor specializes in finger food and wants to sell food in right conical containers so that they are easy for people to hold. to complete his label, gordon needs to collect several different measurements to ensure that the label he designs will fit the surface of the container. gordon has been told that the containers have a diameter of 4 inches and a height of 6 inches. part a: find the slant height of the cone. the slant height is the distance from the apex, or tip, to the base along the cone’s lateral surface. show your work. part b: find the measure of the angle formed between the base of the cone and a line segment that represents the slant height. part c: imagine two line segments where each represents a slant height of the cone. the segments are on opposite sides of the cone and meet at the apex. find the measurement of the angle formed between the line segments.
Answers: 1
Mathematics, 22.06.2019 03:10, hardwick744
Which statement is true about the discontinuities of the function f(x) = x-5/ 3x^2-17x-28
Answers: 2
Do you know the correct answer?
Which function BEST expresses the linear relationship displayed by the scatter plot?
es )
es )
Questions in other subjects:


