

Mathematics, 09.04.2020 17:05, ramandeep
What is the area of this parallelogram? 44 cm² 55 cm² 99 cm² 220 cm² Parallelogram A B C D with side D C parallel to side A B and side A D parallel to side B C. Point F is between points D and C and connects to point B with a dotted segment. Point E is between points A and B is connected to point D with a dotted segment. D F B E is a rectangle with all right angles. D F is 4 centimeters. F C is 5 centimeters. E B is 4 centimeters. A E is 5 centimeters. D E is 11 centimeters.

Answers: 3


Other questions on the subject: Mathematics
Mathematics, 21.06.2019 21:30, gigglegirl5802
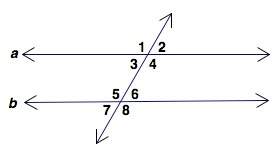
Select all the statements that apply to this figure
Answers: 2
Mathematics, 21.06.2019 21:30, adamsc819
Design an er diagram for keeping track of information about votes taken in the u. s. house of representatives during the current two-year congressional session. the database needs to keep track of each u. s. state's name (e. g., texas', new york', california') and include the region of the state (whose domain is {northeast', midwest', southeast', southwest', west'}). each congress person in the house of representatives is described by his or her name, plus the district represented, the start date when the congressperson was first elected, and the political party to which he or she belongs (whose domain is {republican', democrat', 'independent', other'}). the database keeps track of each bill (i. e., proposed law), including the bill name, the date of vote on the bill, whether the bill passed or failed (whose domain is {yes', no'}), and the sponsor (the congressperson(s) who sponsored - that is, proposed - the bill). the database also keeps track of how each congressperson voted on each bill (domain of vote attribute is {yes', no', abstain', absent'}). additional information:
Answers: 1
Mathematics, 22.06.2019 00:30, trujillo03
1.3.25 question suppose 40​% of all voters voted for a particular candidate. to simulate exit polls regarding whether or not voters voted for this​ candidate, five random samples of size 1010 and five random samples of size 10001000 have been generated using technology using a population proportion of 0.400.40​, with the accompanying results. complete parts a through c below. click the icon to view the simulation results. a. observe how the sample proportions of successes vary around 0.400.40. simulation compared to sample prop simulation compared to sample prop 1 ▾ 6 ▾ greater than 0.40 less than 0.40 equal to 0.40 2 ▾ less than 0.40 greater than 0.40 equal to 0.40 7 ▾ greater than 0.40 less than 0.40 equal to 0.40 3 ▾ greater than 0.40 less than 0.40 equal to 0.40 8 ▾ equal to 0.40 greater than 0.40 less than 0.40 4 ▾ greater than 0.40 equal to 0.40 less than 0.40 9 ▾ less than 0.40 greater than 0.40 equal to 0.40 5 ▾ equal to 0.40 less than 0.40 greater than 0.40 10 ▾ equal to 0.40 greater than 0.40 less than 0.40 click to select your answer(s) and then click check answer. 2 parts remaining clear all check answer
Answers: 3
Do you know the correct answer?
What is the area of this parallelogram? 44 cm² 55 cm² 99 cm² 220 cm² Parallelogram A B C D with side...
Questions in other subjects:

Chemistry, 10.04.2020 00:25


Physics, 10.04.2020 00:25
Mathematics, 10.04.2020 00:25
Mathematics, 10.04.2020 00:25


Biology, 10.04.2020 00:25


