


Relationship b has a lesser rate than relationship a. the graph represents relationship a.
wh...

Mathematics, 16.10.2019 16:30, alisa1600000
Relationship b has a lesser rate than relationship a. the graph represents relationship a.
which table could represent relationship b?
first-quadrant graph showing a ray from the origin through the points (5, 2) and (10, 4).
horizontal axis label is time in weeks. vertical axis label is plant growth in inches.
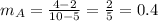
a.
time (weeks) 3 4 6 9
plant growth (in.) 1.8 2.4 3.6 5.4
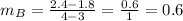
b.
time (weeks) 3 4 6 9
plant growth (in.) 0.9 1.2 1.8 2.7
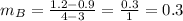
c.
time (weeks) 3 4 6 9
plant growth (in.) 1.5 2 3 4.5
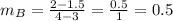
d.
time (weeks) 3 4 6 9
plant growth (in.) 2.7 3.6 5.4 8.1

Answers: 2
Other questions on the subject: Mathematics
Mathematics, 21.06.2019 14:00, Pauline3607
Use the knowledge of x- and y- intercepts to choose the correct graph of the equation 3x+6y=6
Answers: 1
Mathematics, 21.06.2019 17:00, figueroajorge8291
Joseph haydn pet store offers wide variety of leashes for dogs. the store purchases one popular type of leash from its manufacturer for $4.38 each. joseph haydn pets marks up leashes at a rate of 238% of cost. what is the retail price of the popular leash?
Answers: 1
Mathematics, 21.06.2019 23:00, tonimgreen17p6vqjq
Which graph represents the linear function below? y-3=1/2(x+2)
Answers: 2
Do you know the correct answer?
Questions in other subjects:

Mathematics, 02.09.2019 15:10


English, 02.09.2019 15:20

Biology, 02.09.2019 15:20


