

Mathematics, 08.04.2020 20:38, rarityxrose
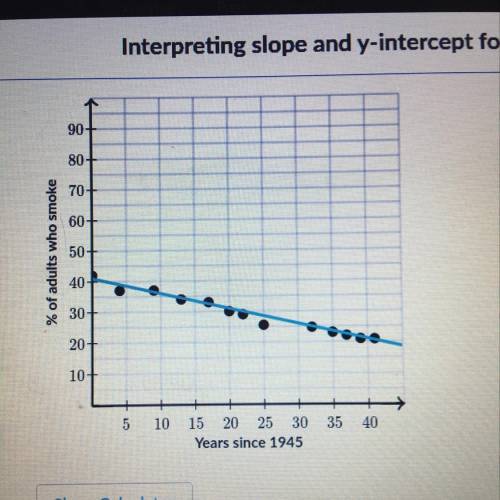
The scatter plot and regression line below show the relationship between the percentage of American adults who smoke and years since 1945.
The fitted line has a y-intercept of 41.
What is the best interpretation of this y-intercept?
A. The model indicates that 41% of American
adults smoked in 1945
B.41% of American adults smoke.
C. In 1945,approximately 0% of American adults were smokers
D. The model indicates that approximately 41% of Americans adults smoked in 1985

Answers: 1


Other questions on the subject: Mathematics
Mathematics, 21.06.2019 22:00, danielahalesp87vj0
18 16 11 45 33 11 33 14 18 11 what is the mode for this data set
Answers: 2
Mathematics, 21.06.2019 23:00, alyonaprotopopova
What ia the sum if the first 7 terms of the geometric series
Answers: 2
Do you know the correct answer?
The scatter plot and regression line below show the relationship between the percentage of American...
Questions in other subjects:

History, 01.07.2019 21:00


Computers and Technology, 01.07.2019 21:00

Arts, 01.07.2019 21:00
History, 01.07.2019 21:00
Mathematics, 01.07.2019 21:00

History, 01.07.2019 21:00


