


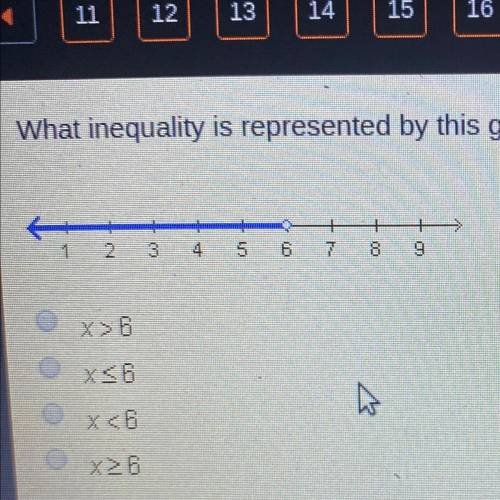
What inequality is represented by this graph. A. X>6 b. x<_6 c. X<6 D. X>_6
...

Mathematics, 07.04.2020 02:48, andrejr0330jr
What inequality is represented by this graph. A. X>6 b. x<_6 c. X<6 D. X>_6

Answers: 2
Other questions on the subject: Mathematics
Mathematics, 21.06.2019 13:30, 2021sherodisabella
Malia is observing the velocity of a cyclist at different times. after two hours, the velocity of the cyclist is 15 km/h. after five hours, the velocity of the cyclist is 12 km/h. part a: write an equation in two variables in the standard form that can be used to describe the velocity of the cyclist at different times. show your work and define the variables used. (5 points) part b: how can you graph the equations obtained in part a for the first 12 hours? (5 points) if you can try and make this as little confusing as you can
Answers: 2
Do you know the correct answer?
Questions in other subjects:


Biology, 15.10.2021 14:00

Social Studies, 15.10.2021 14:00

Mathematics, 15.10.2021 14:00

Mathematics, 15.10.2021 14:00


