


The graph shows the amount of water being filled over time.
For each tank, explain whether or...

Mathematics, 06.04.2020 18:27, GhostBoooty
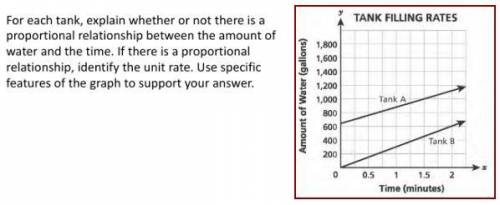
The graph shows the amount of water being filled over time.
For each tank, explain whether or not there is a proportional relationship between the amount of water, in gallons, and the time in minutes. If there is a proportional relationship, identify the unit rate. Use specific features of the graph to support your answer.

Answers: 3
Other questions on the subject: Mathematics
Mathematics, 21.06.2019 14:00, williamrobinson93
How can you find the conditional probability of a given b as the fraction of b’s outcomes that also belong to a, and interpret the answer in terms of the model? i just need a good explanation
Answers: 2
Mathematics, 21.06.2019 15:00, katie18147
Answer this question only if you know the answer! 30 points and
Answers: 1
Mathematics, 21.06.2019 23:40, asiababbie33
Agrid shows the positions of a subway stop and your house. the subway stop is located at (-5,2) and your house is located at (-9,9). what is the distance, to the nearest unit, between your house and the subway stop?
Answers: 1
Do you know the correct answer?
Questions in other subjects:


History, 02.07.2019 15:00
Mathematics, 02.07.2019 15:00


Social Studies, 02.07.2019 15:00

Health, 02.07.2019 15:00
Mathematics, 02.07.2019 15:00


