

Mathematics, 05.04.2020 21:57, knowingwhat
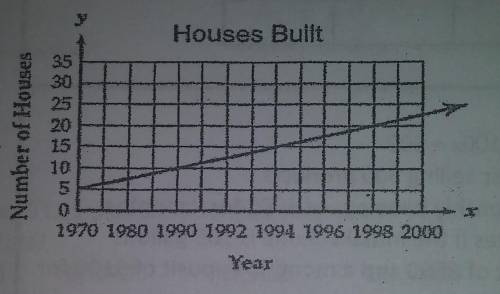
The graph shows the number of new houses built from 1970 to 2000. The mayor used the graph to claim the number built increased at a constant rate.
A) It is valid because the graph shows a constant rate of change.
B) It is valid because 30 years is long enough to evaluate the increase.
C) It is not valid because the scale on the vertical axis is inappropriate.
D) It is not valid because the scale on the horizontal axis is inappropriate.

Answers: 1


Other questions on the subject: Mathematics
Mathematics, 21.06.2019 13:30, pstat
What are potential hypotheses (explanations) regarding why there are ecological equivalents between many metatherians and eutherians? discuss your hypothesis in terms of the processes that could lead to the current ecologies and distributions of metatherians and eutherians.
Answers: 2
Mathematics, 21.06.2019 19:00, yehnerthannah
Through non-collinear points there is exactly one plane.
Answers: 1
Mathematics, 21.06.2019 19:00, babygirlmiller
The weight of an object in the water is 7% of its weight out of the water. what is the weight of a 652g object in the water?
Answers: 1
Do you know the correct answer?
The graph shows the number of new houses built from 1970 to 2000. The mayor used the graph to claim...
Questions in other subjects:
Mathematics, 17.10.2020 23:01

Mathematics, 17.10.2020 23:01

Biology, 17.10.2020 23:01

English, 17.10.2020 23:01
English, 17.10.2020 23:01
Mathematics, 17.10.2020 23:01


