
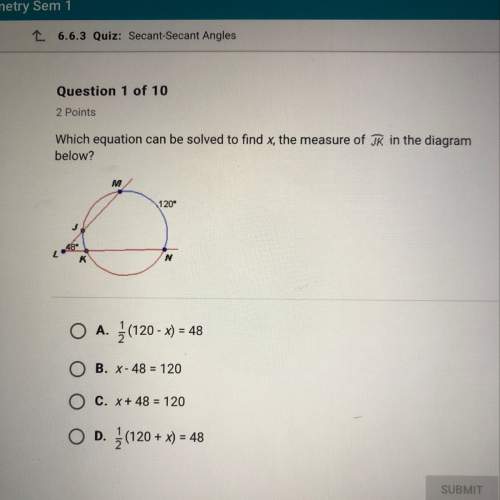


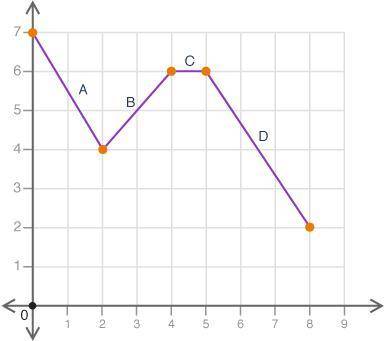
Which of the following best describes interval C on the graph shown? (4 points)
A coordinate p...

Mathematics, 04.04.2020 08:42, Jsmooth8928
Which of the following best describes interval C on the graph shown? (4 points)
A coordinate plane is shown. The line decreases from x equals 0 to 2, then increases from 2 to 4, stays horizontal from 4 to 5, and decreases from 5 to 8.
Linear constant
Linear decreasing
Linear increasing
Nonlinear increasing

Answers: 1
Other questions on the subject: Mathematics
Mathematics, 22.06.2019 03:00, lucypackham9
(: the two box-and- whisker plots below show the scores on a math exam for two classes. what 2 things do the interquartile range tell you about the two classes?
Answers: 2
Mathematics, 22.06.2019 04:30, medellincolombia99
Who can me with this algebra for your guys.
Answers: 1
Mathematics, 22.06.2019 04:30, oscarmendoza2107
The ordered pair (2,-5.2) is located in quadrant iv
Answers: 1
Do you know the correct answer?
Questions in other subjects:


