


The graph shows a point of equilibrium.
A graph has Quantity supplied on the x-axis and...

Mathematics, 02.04.2020 22:36, tonya3498
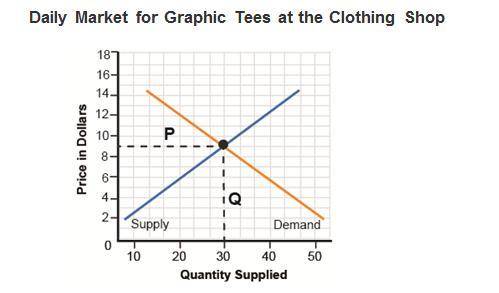
The graph shows a point of equilibrium.
A graph has Quantity supplied on the x-axis and price in dollars on the y-axis. A line that represents supply has a positive slope and a line that represents demand has a negative slope. The lines intersect at point (30, 9). Line P is drawn from the point of equilibrium to the y-axis, and line Q is drawn from the point of equilibrium to the x-axis.
What does "P" represent on the graph?
the point where equilibrium is achieved
the price at the equilibrium point
the average price of goods sold
the point where supply and demand drop

Answers: 1
Other questions on the subject: Mathematics
Mathematics, 21.06.2019 18:30, isabellacampos4586
It took alice 5 5/6 hours to drive to her grandparents' house for . on the way home, she ran into traffic and it took her 7 3/8 hours. how much longer did the return trip take? write your answer as a proper fraction or mixed number in simplest form. the trip home took __hours longer. ?
Answers: 1
Mathematics, 21.06.2019 19:00, wannaoneisforever
What numbers are included in the set of integers? what numbers are not included?
Answers: 2
Mathematics, 21.06.2019 21:50, bcox32314
Desmond wants to sell his car that he paid $8,000 for 2 years ago. the car depreciated, or decreased in value, at a constant rate each month over a 2-year period. if x represents the monthly depreciation amount, which expression shows how much desmond can sell his car for today? \ 8,000 + 24x 8,000 - 24x 8,000 + 2x 8,000 - 2x
Answers: 3
Do you know the correct answer?
Questions in other subjects:

SAT, 14.12.2021 01:20

Mathematics, 14.12.2021 01:20

Chemistry, 14.12.2021 01:20
History, 14.12.2021 01:20
Mathematics, 14.12.2021 01:20


