


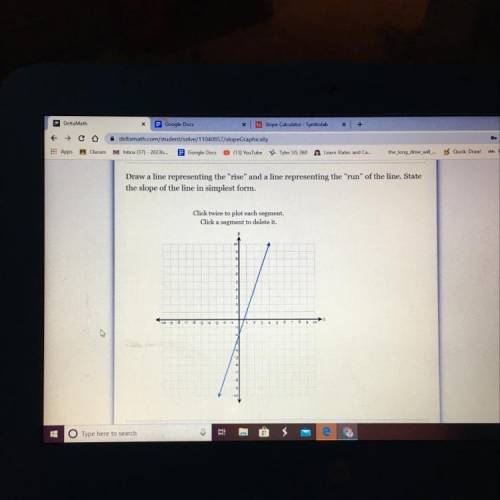
Draw a line representing the "rise" and a line representing the "run" of the line. State
the s...

Mathematics, 02.04.2020 19:59, Mikkixo3114
Draw a line representing the "rise" and a line representing the "run" of the line. State
the slope of the line in simplest form.
Click twice to plot each segment.
Click a segment to delete it.

Answers: 1
Other questions on the subject: Mathematics
Mathematics, 21.06.2019 14:30, lizzie3545
Which quadratic function best fits this data? x y 1 32 2 78 3 178 4 326 5 390 6 337 a. y=11.41x2+154.42x−143.9 b. y=−11.41x2+154.42x−143.9 c. y=11.41x2+154.42x+143.9 d. y=−11.41x2+154.42x+143.9
Answers: 3
Mathematics, 21.06.2019 19:00, dfrtgyuhijfghj4794
Since opening night, attendance at play a has increased steadily, while attendance at play b first rose and then fell. equations modeling the daily attendance y at each play are shown below, where x is the number of days since opening night. on what day(s) was the attendance the same at both plays? what was the attendance? play a: y = 8x + 191 play b: y = -x^2 + 26x + 126 a. the attendance was never the same at both plays. b. the attendance was the same on day 5. the attendance was 231 at both plays on that day. c. the attendance was the same on day 13. the attendance was 295 at both plays on that day. d. the attendance was the same on days 5 and 13. the attendance at both plays on those days was 231 and 295 respectively.
Answers: 1
Mathematics, 21.06.2019 20:00, cferguson
Someone answer asap for ! the total ticket sales for a high school basketball game were $2,260. the ticket price for students were $2.25 less than the adult ticket price. the number of adult tickets sold was 230, and the number of student tickets sold was 180. what was the price of an adult ticket?
Answers: 1
Do you know the correct answer?
Questions in other subjects:
Mathematics, 18.10.2021 20:20
Mathematics, 18.10.2021 20:20


Mathematics, 18.10.2021 20:20

History, 18.10.2021 20:20


