
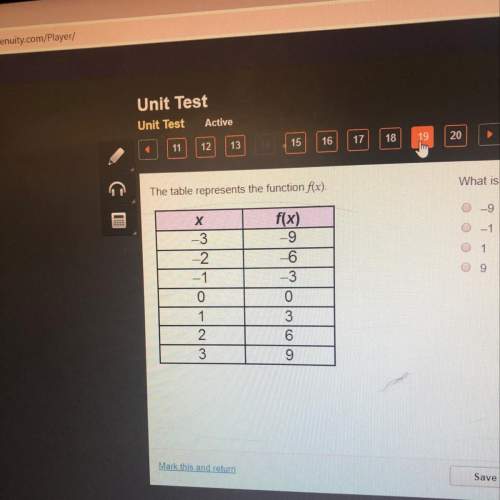


The table shows the values of y for different values of x:
x 7 8 9 10 11 12 13
y 1...

Mathematics, 02.04.2020 07:09, cxttiemsp021
The table shows the values of y for different values of x:
x 7 8 9 10 11 12 13
y 13 10 7 6 5 3 0
The correlation coefficient for the data is −0.9847. Which statement is true about the data in the table?
There is no relationship between x and y.
There is a weak negative relationship between x and y.
There is a strong positive relationship between x and y.
There is a strong negative relationship between x and y.

Answers: 2
Other questions on the subject: Mathematics
Mathematics, 21.06.2019 17:30, nurmukhammada
Can someone me with this problem i don't understand i need
Answers: 2
Mathematics, 21.06.2019 18:00, Tellyy8104
On a piece of paper, graph y< x+1. then determine which answer matches the graph you drew.
Answers: 2
Mathematics, 21.06.2019 20:30, alexialiles19
Max recorded the heights of 500 male humans. he found that the heights were normally distributed around a mean of 177 centimeters. which statements about max’s data must be true? a) the median of max’s data is 250 b) more than half of the data points max recorded were 177 centimeters. c) a data point chosen at random is as likely to be above the mean as it is to be below the mean. d) every height within three standard deviations of the mean is equally likely to be chosen if a data point is selected at random.
Answers: 2
Mathematics, 21.06.2019 20:30, nosugh
If m∠abc = 70°, what is m∠abd? justify your reasoning. using the addition property of equality, 40 + 70 = 110, so m∠abd = 110°. using the subtraction property of equality, 70 − 30 = 40, so m∠abd = 30°. using the angle addition postulate, 40 + m∠abd = 70. so, m∠abd = 30° using the subtraction property of equality. using the angle addition postulate, 40 + 70 = m∠abd. so, m∠abd = 110° using the addition property of equality.
Answers: 2
Do you know the correct answer?
Questions in other subjects:

Social Studies, 08.12.2020 16:40

Business, 08.12.2020 16:40


Chemistry, 08.12.2020 16:40

Arts, 08.12.2020 16:40

History, 08.12.2020 16:40


