
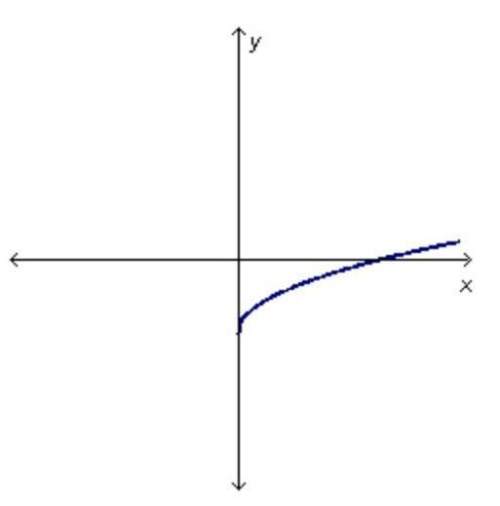


Using the table below. Which graph represents the relationship in this table?
x 3 1 0 2...

Mathematics, 02.04.2020 06:04, anthonyfr10004
Using the table below. Which graph represents the relationship in this table?
x 3 1 0 2 4
y -3 -1 0 -2 -4

Answers: 3
Other questions on the subject: Mathematics
Mathematics, 21.06.2019 19:30, kayla232734
When x = 3 and y = 5, by how much does the value of 3x2 – 2y exceed the value of 2x2 – 3y ?
Answers: 2
Mathematics, 21.06.2019 21:30, francescanajar5
Your friend uses c=50p to find the total cost, c, for the people, p, entering a local amusement park is the cost of admission proportional to the amount of people entering the amusement park? explain.
Answers: 2
Do you know the correct answer?
Questions in other subjects:


Social Studies, 18.03.2021 01:50

Mathematics, 18.03.2021 01:50

Social Studies, 18.03.2021 01:50
Mathematics, 18.03.2021 01:50

Chemistry, 18.03.2021 01:50


