


What is true of the data in the dot plot? Check all that apply.
Number of Minutes Shelly Spent...

Mathematics, 01.04.2020 21:03, JarretteWhitaker
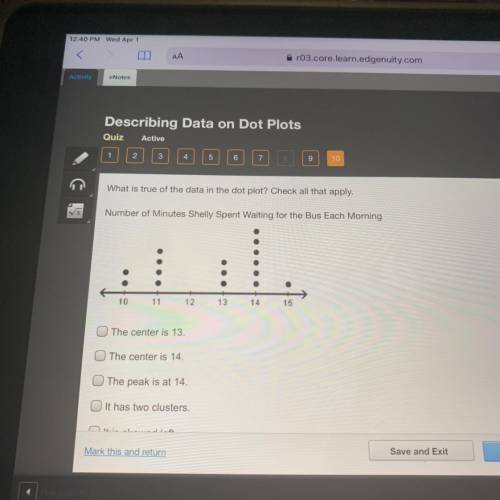
What is true of the data in the dot plot? Check all that apply.
Number of Minutes Shelly Spent Waiting for the Bus Each Morning
The center is 13.
The center is 14.
The peak is at 14.
It has two clusters.
It is skewed left.
The spread is from 13 to 15.
The person waited for the bus 16 times.
Please help i’m not sure
:(

Answers: 2
Other questions on the subject: Mathematics
Mathematics, 21.06.2019 18:00, ReeseMoffitt8032
In a graph with several intervals o data how does a constant interval appear? what type of scenario produces a constant interval?
Answers: 1
Mathematics, 21.06.2019 23:00, maiacheerz
12 out of 30 people chose their favourite colour as blue caculate the angle you would use for blue on a pie chart
Answers: 1
Mathematics, 22.06.2019 01:00, AvaHeff
The stem-and-leaf plot shows the heights in centimeters of teddy bear sunflowers grown in two different types of soil. soil a soil b 5 9 5 2 1 1 6 3 9 5 1 0 7 0 2 3 6 7 8 2 1 8 3 0 9 key: 9|6 means 69 key: 5|8 means 58 calculate the mean of each data set. calculate the mean absolute deviation (mad) of each data set. which set is more variable? how do you know?
Answers: 2
Do you know the correct answer?
Questions in other subjects:
Mathematics, 29.08.2021 09:50


Mathematics, 29.08.2021 14:00


