


Scatter Plots - Quiz - Level H
Question 3
The scatter plot below shows the relationship...

Mathematics, 31.03.2020 20:42, ctyrector
Scatter Plots - Quiz - Level H
Question 3
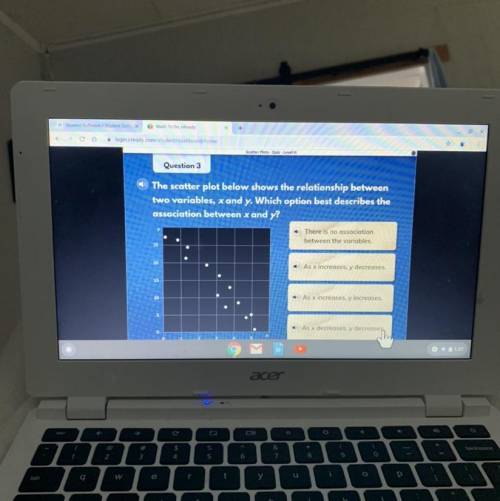
The scatter plot below shows the relationship between
two variables, x and y. Which option best describes the
association between x and y?
There is no association
between the variables.
As x increases, y decreases.
As x increases, y increases.
As x decreases, y decreases,

Answers: 3
Other questions on the subject: Mathematics
Mathematics, 21.06.2019 13:30, Chipper4085
An animal shelter has 21 puppies. if the puppies are 28% of the total dogs and cat population how many dogs and cats are in the animal shelter
Answers: 1
Mathematics, 21.06.2019 18:00, MayFlowers
Name each raycalculation tip: in ray "ab", a is the endpoint of the ray.
Answers: 1
Mathematics, 22.06.2019 00:20, kaybec2386
Data for the height of a model rocket launch in the air over time are shown in the table. darryl predicted that the height of the rocket at 8 seconds would be about 93 meters. did darryl make a good prediction? yes, the data are best modeled by a quadratic function. the value of the function at 8 seconds is about 93 meters. yes, the data are best modeled by a linear function. the first differences are constant, so about 93 meters at 8 seconds is reasonable. no, the data are exponential. a better prediction is 150 meters. no, the data are best modeled by a cubic function. a better prediction is 100 meters.
Answers: 2
Do you know the correct answer?
Questions in other subjects:

History, 23.11.2020 14:00


Social Studies, 23.11.2020 14:00

Computers and Technology, 23.11.2020 14:00


English, 23.11.2020 14:00


