


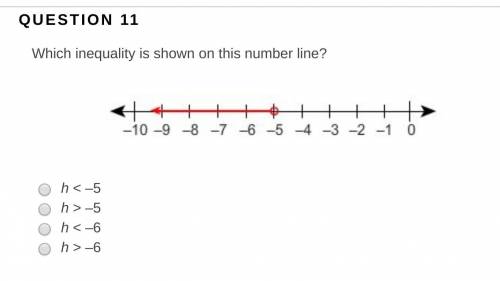
Which inequality is shown on this number line?
Graph of an inequality from negative 5 an...

Mathematics, 30.03.2020 21:23, jcbballer
Which inequality is shown on this number line?
Graph of an inequality from negative 5 and all values to the left on a number line. Negative 5 is not included.
h < –5
h > –5
h < –6
h > –6

Answers: 2
Other questions on the subject: Mathematics
Mathematics, 21.06.2019 17:30, Hilljos018
The length of triangle base is 26. a line, which is parallel to the base divides the triangle into two equal area parts. find the length of the segment between triangle legs.
Answers: 3
Mathematics, 21.06.2019 17:30, sarahhfaithhh
One line passes through (-7,-4) and (5,4) . another line passes through the point (-4,6) and (6,-9)
Answers: 1
Mathematics, 21.06.2019 18:30, 420420blazee
You were told that the amount of time lapsed between consecutive trades on the new york stock exchange followed a normal distribution with a mean of 15 seconds. you were also told that the probability that the time lapsed between two consecutive trades to fall between 16 to 17 seconds was 13%. the probability that the time lapsed between two consecutive trades would fall below 13 seconds was 7%. what is the probability that the time lapsed between two consecutive trades will be between 14 and 15 seconds?
Answers: 3
Do you know the correct answer?
Questions in other subjects:


